
 Yahoo Finance
 Is CGI Inc.'s (TSE:GIB.A) Latest Stock Performance A Reflection Of Its Financial Health?
CGI's (TSE:GIB.A) stock is up by a considerable 11% over the past three months. Given the company's impressive performance, we decided to study its financial indicators more closely as a company's financial health over the long-term usually dictates market outcomes. Particularly, we will be paying attention to CGI's ROE today.
ROE or return on equity is a useful tool to assess how effectively a company can generate returns on the investment it received from its shareholders. Simply put, it is used to assess the profitability of a company in relation to its equity capital.
See our latest analysis for CGI
How Is ROE Calculated?
ROE can be calculated by using the formula:
Return on Equity = Net Profit (from continuing operations) ÷ Shareholders' Equity
So, based on the above formula, the ROE for CGI is:
20% = CA$1.5b ÷ CA$7.3b (Based on the trailing twelve months to September 2022).
The 'return' refers to a company's earnings over the last year. One way to conceptualize this is that for each CA$1 of shareholders' capital it has, the company made CA$0.20 in profit.
What Has ROE Got To Do With Earnings Growth?
Thus far, we have learned that ROE measures how efficiently a company is generating its profits. Depending on how much of these profits the company reinvests or "retains", and how effectively it does so, we are then able to assess a company’s earnings growth potential. Assuming everything else remains unchanged, the higher the ROE and profit retention, the higher the growth rate of a company compared to companies that don't necessarily bear these characteristics.
A Side By Side comparison of CGI's Earnings Growth And 20% ROE
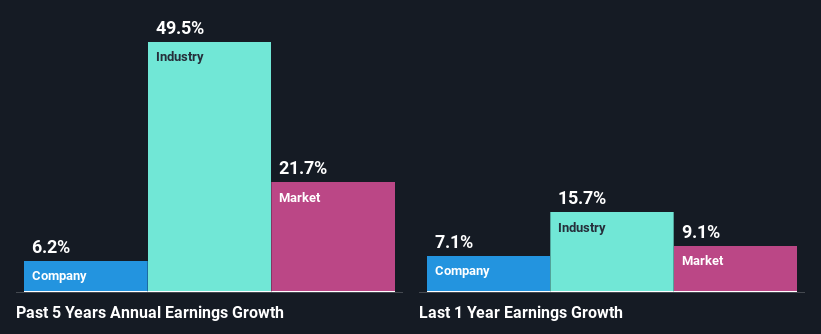
To begin with, CGI seems to have a respectable ROE. On comparing with the average industry ROE of 5.4% the company's ROE looks pretty remarkable. Probably as a result of this, CGI was able to see a decent growth of 6.2% over the last five years.
We then compared CGI's net income growth with the industry and found that the company's growth figure is lower than the average industry growth rate of 49% in the same period, which is a bit concerning.
The basis for attaching value to a company is, to a great extent, tied to its earnings growth. The investor should try to establish if the expected growth or decline in earnings, whichever the case may be, is priced in. By doing so, they will have an idea if the stock is headed into clear blue waters or if swampy waters await. If you're wondering about CGI's's valuation, check out this gauge of its price-to-earnings ratio, as compared to its industry.
Is CGI Making Efficient Use Of Its Profits?
CGI doesn't pay any dividend currently which essentially means that it has been reinvesting all of its profits into the business. This definitely contributes to the decent earnings growth number that we discussed above.
Conclusion
On the whole, we feel that CGI's performance has been quite good. Particularly, we like that the company is reinvesting heavily into its business, and at a high rate of return. As a result, the decent growth in its earnings is not surprising. The latest industry analyst forecasts show that the company is expected to maintain its current growth rate. To know more about the company's future earnings growth forecasts take a look at this free report on analyst forecasts for the company to find out more.
Have feedback on this article? Concerned about the content? Get in touch with us directly. Alternatively, email editorial-team (at) simplywallst.com.
This article by Simply Wall St is general in nature. We provide commentary based on historical data and analyst forecasts only using an unbiased methodology and our articles are not intended to be financial advice. It does not constitute a recommendation to buy or sell any stock, and does not take account of your objectives, or your financial situation. We aim to bring you long-term focused analysis driven by fundamental data. Note that our analysis may not factor in the latest price-sensitive company announcements or qualitative material. Simply Wall St has no position in any stocks mentioned.
Join A Paid User Research Session
You’ll receive a US$30 Amazon Gift card for 1 hour of your time while helping us build better investing tools for the individual investors like yourself. Sign up here
