
 Yahoo Finance
 What Is Charles Stanley Group's (LON:CAY) P/E Ratio After Its Share Price Rocketed?

Charles Stanley Group (LON:CAY) shareholders are no doubt pleased to see that the share price has had a great month, posting a 36% gain, recovering from prior weakness. The full year gain of 21% is pretty reasonable, too.
Assuming no other changes, a sharply higher share price makes a stock less attractive to potential buyers. In the long term, share prices tend to follow earnings per share, but in the short term prices bounce around in response to short term factors (which are not always obvious). The implication here is that deep value investors might steer clear when expectations of a company are too high. Perhaps the simplest way to get a read on investors' expectations of a business is to look at its Price to Earnings Ratio (PE Ratio). A high P/E ratio means that investors have a high expectation about future growth, while a low P/E ratio means they have low expectations about future growth.
See our latest analysis for Charles Stanley Group
Does Charles Stanley Group Have A Relatively High Or Low P/E For Its Industry?
We can tell from its P/E ratio of 14.53 that sentiment around Charles Stanley Group isn't particularly high. The image below shows that Charles Stanley Group has a lower P/E than the average (19.6) P/E for companies in the capital markets industry.
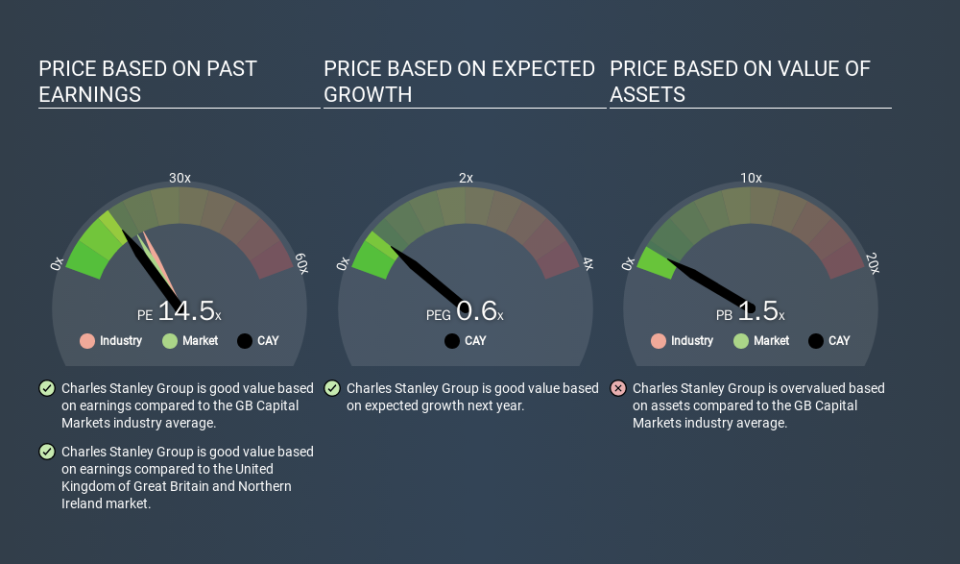
Its relatively low P/E ratio indicates that Charles Stanley Group shareholders think it will struggle to do as well as other companies in its industry classification. Many investors like to buy stocks when the market is pessimistic about their prospects. You should delve deeper. I like to check if company insiders have been buying or selling.
How Growth Rates Impact P/E Ratios
Generally speaking the rate of earnings growth has a profound impact on a company's P/E multiple. That's because companies that grow earnings per share quickly will rapidly increase the 'E' in the equation. Therefore, even if you pay a high multiple of earnings now, that multiple will become lower in the future. A lower P/E should indicate the stock is cheap relative to others -- and that may attract buyers.
Charles Stanley Group's 55% EPS improvement over the last year was like bamboo growth after rain; rapid and impressive. Even better, EPS is up 105% per year over three years. So we'd absolutely expect it to have a relatively high P/E ratio.
Don't Forget: The P/E Does Not Account For Debt or Bank Deposits
Don't forget that the P/E ratio considers market capitalization. That means it doesn't take debt or cash into account. Hypothetically, a company could reduce its future P/E ratio by spending its cash (or taking on debt) to achieve higher earnings.
While growth expenditure doesn't always pay off, the point is that it is a good option to have; but one that the P/E ratio ignores.
How Does Charles Stanley Group's Debt Impact Its P/E Ratio?
With net cash of UK£70m, Charles Stanley Group has a very strong balance sheet, which may be important for its business. Having said that, at 41% of its market capitalization the cash hoard would contribute towards a higher P/E ratio.
The Verdict On Charles Stanley Group's P/E Ratio
Charles Stanley Group trades on a P/E ratio of 14.5, which is below the GB market average of 17.2. It grew its EPS nicely over the last year, and the healthy balance sheet implies there is more potential for growth. The relatively low P/E ratio implies the market is pessimistic. What is very clear is that the market has become more optimistic about Charles Stanley Group over the last month, with the P/E ratio rising from 10.7 back then to 14.5 today. If you like to buy stocks that have recently impressed the market, then this one might be a candidate; but if you prefer to invest when there is 'blood in the streets', then you may feel the opportunity has passed.
Investors should be looking to buy stocks that the market is wrong about. If it is underestimating a company, investors can make money by buying and holding the shares until the market corrects itself. So this free visual report on analyst forecasts could hold the key to an excellent investment decision.
Of course, you might find a fantastic investment by looking at a few good candidates. So take a peek at this free list of companies with modest (or no) debt, trading on a P/E below 20.
If you spot an error that warrants correction, please contact the editor at editorial-team@simplywallst.com. This article by Simply Wall St is general in nature. It does not constitute a recommendation to buy or sell any stock, and does not take account of your objectives, or your financial situation. Simply Wall St has no position in the stocks mentioned.
We aim to bring you long-term focused research analysis driven by fundamental data. Note that our analysis may not factor in the latest price-sensitive company announcements or qualitative material. Thank you for reading.
