
 Yahoo Finance
 Should You Be Concerned About The Duckhorn Portfolio, Inc.'s (NYSE:NAPA) ROE?
Many investors are still learning about the various metrics that can be useful when analysing a stock. This article is for those who would like to learn about Return On Equity (ROE). To keep the lesson grounded in practicality, we'll use ROE to better understand The Duckhorn Portfolio, Inc. (NYSE:NAPA).
Return on equity or ROE is an important factor to be considered by a shareholder because it tells them how effectively their capital is being reinvested. In simpler terms, it measures the profitability of a company in relation to shareholder's equity.
View our latest analysis for Duckhorn Portfolio
How Do You Calculate Return On Equity?
The formula for return on equity is:
Return on Equity = Net Profit (from continuing operations) ÷ Shareholders' Equity
So, based on the above formula, the ROE for Duckhorn Portfolio is:
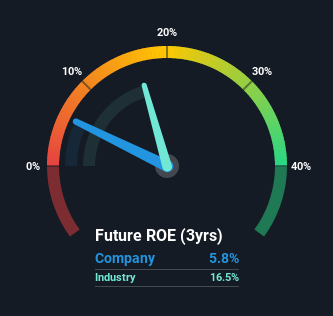
5.8% = US$46m ÷ US$794m (Based on the trailing twelve months to April 2021).
The 'return' is the income the business earned over the last year. So, this means that for every $1 of its shareholder's investments, the company generates a profit of $0.06.
Does Duckhorn Portfolio Have A Good ROE?
One simple way to determine if a company has a good return on equity is to compare it to the average for its industry. The limitation of this approach is that some companies are quite different from others, even within the same industry classification. As shown in the graphic below, Duckhorn Portfolio has a lower ROE than the average (16%) in the Beverage industry classification.
Unfortunately, that's sub-optimal. That being said, a low ROE is not always a bad thing, especially if the company has low leverage as this still leaves room for improvement if the company were to take on more debt. When a company has low ROE but high debt levels, we would be cautious as the risk involved is too high.
How Does Debt Impact Return On Equity?
Most companies need money -- from somewhere -- to grow their profits. That cash can come from issuing shares, retained earnings, or debt. In the first two cases, the ROE will capture this use of capital to grow. In the latter case, the debt used for growth will improve returns, but won't affect the total equity. Thus the use of debt can improve ROE, albeit along with extra risk in the case of stormy weather, metaphorically speaking.
Duckhorn Portfolio's Debt And Its 5.8% ROE
Duckhorn Portfolio has a debt to equity ratio of 0.34, which is far from excessive. Although the ROE isn't overly impressive, the debt load is modest, suggesting the business has potential. Careful use of debt to boost returns is often very good for shareholders. However, it could reduce the company's ability to take advantage of future opportunities.
Summary
Return on equity is a useful indicator of the ability of a business to generate profits and return them to shareholders. A company that can achieve a high return on equity without debt could be considered a high quality business. If two companies have around the same level of debt to equity, and one has a higher ROE, I'd generally prefer the one with higher ROE.
Having said that, while ROE is a useful indicator of business quality, you'll have to look at a whole range of factors to determine the right price to buy a stock. Profit growth rates, versus the expectations reflected in the price of the stock, are a particularly important to consider. So you might want to check this FREE visualization of analyst forecasts for the company.
Of course, you might find a fantastic investment by looking elsewhere. So take a peek at this free list of interesting companies.
This article by Simply Wall St is general in nature. It does not constitute a recommendation to buy or sell any stock, and does not take account of your objectives, or your financial situation. We aim to bring you long-term focused analysis driven by fundamental data. Note that our analysis may not factor in the latest price-sensitive company announcements or qualitative material. Simply Wall St has no position in any stocks mentioned.
Have feedback on this article? Concerned about the content? Get in touch with us directly. Alternatively, email editorial-team (at) simplywallst.com.
