
 Yahoo Finance
 Should You Be Concerned With Redrow plc's (LON:RDW) -2.5% Earnings Drop?

Assessing Redrow plc's (LSE:RDW) past track record of performance is an insightful exercise for investors. It allows us to reflect on whether or not the company has met or exceed expectations, which is a great indicator for future performance. Today I will assess RDW's recent performance announced on 31 December 2019 and evaluate these figures to its long-term trend and industry movements.
Check out our latest analysis for Redrow
Was RDW weak performance lately part of a long-term decline?
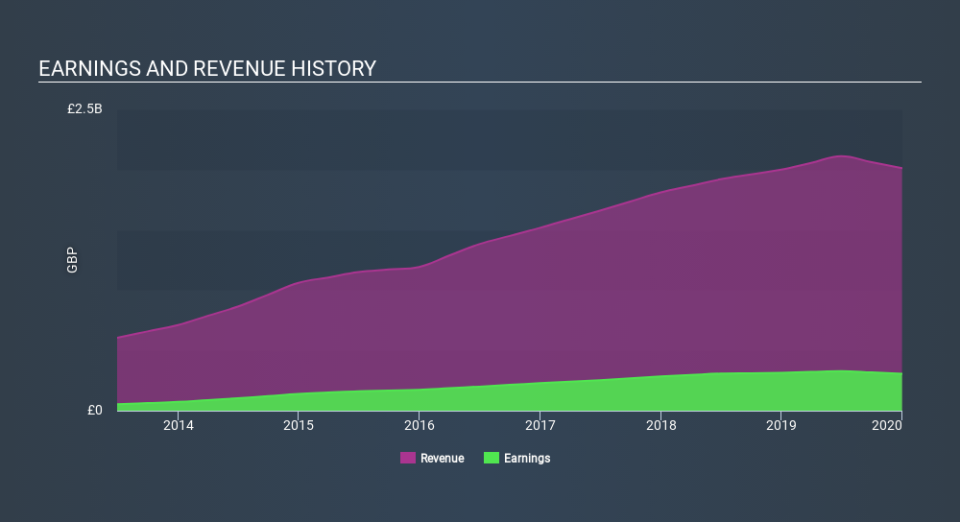
RDW's trailing twelve-month earnings (from 31 December 2019) of UK£307m has declined by -2.5% compared to the previous year.
Furthermore, this one-year growth rate has been lower than its average earnings growth rate over the past 5 years of 17%, indicating the rate at which RDW is growing has slowed down. What could be happening here? Well, let’s take a look at what’s transpiring with margins and if the whole industry is experiencing the hit as well.
In terms of returns from investment, Redrow has fallen short of achieving a 20% return on equity (ROE), recording 19% instead. However, its return on assets (ROA) of 12% exceeds the GB Consumer Durables industry of 7.8%, indicating Redrow has used its assets more efficiently. Though, its return on capital (ROC), which also accounts for Redrow’s debt level, has declined over the past 3 years from 21% to 21%.
What does this mean?
Redrow's track record can be a valuable insight into its earnings performance, but it certainly doesn't tell the whole story. Companies that are profitable, but have unpredictable earnings, can have many factors impacting its business. You should continue to research Redrow to get a more holistic view of the stock by looking at:
Future Outlook: What are well-informed industry analysts predicting for RDW’s future growth? Take a look at our free research report of analyst consensus for RDW’s outlook.
Financial Health: Are RDW’s operations financially sustainable? Balance sheets can be hard to analyze, which is why we’ve done it for you. Check out our financial health checks here.
Other High-Performing Stocks: Are there other stocks that provide better prospects with proven track records? Explore our free list of these great stocks here.
NB: Figures in this article are calculated using data from the trailing twelve months from 31 December 2019. This may not be consistent with full year annual report figures.
If you spot an error that warrants correction, please contact the editor at editorial-team@simplywallst.com. This article by Simply Wall St is general in nature. It does not constitute a recommendation to buy or sell any stock, and does not take account of your objectives, or your financial situation. Simply Wall St has no position in the stocks mentioned.
We aim to bring you long-term focused research analysis driven by fundamental data. Note that our analysis may not factor in the latest price-sensitive company announcements or qualitative material. Thank you for reading.
