
 Yahoo Finance
 Concerns about mega-cap FAAMG companies and market concentration may be overblown
They're all heavily diversified
A version of this post was originally published on TKer.co
Stocks climbed last week, with the S&P 500 rising 0.9%. The index is now up 8.6% year to date, up 16.6% from its October 12 closing low of 3,577.03, and down 13.0% from its January 3, 2022 closing high of 4,796.56.
Every once in a while, we’re reminded that a handful of stocks account for an outsized share of the S&P 500, and sometimes it’s the case that they’re responsible for driving the market’s gains or losses.
With mega-cap tech companies announcing earnings last week, we got a fresh reminder of these trends.
In a research note on Tuesday (via Notes), JPMorgan’s Dubravko Lakos-Bujas observed that the so-called FAAMG companies — Facebook (now Meta Platforms), Apple, Amazon, Microsoft, and Google (now Alphabet) — account for about 21% of the S&P 500. The $2.6 trillion Apple and $2 trillion Microsoft account for about 13%.

As you can see from Lakos-Bujas’ charts, this isn’t exactly breaking news as these companies have represented an outsized share of the S&P for the past few years.
What is news, however, is how they’ve been driving market returns this year.
On Wednesday, S&P Dow Jones Indices (via Notes) noted that “more than 5% of the S&P 500’s year-to-date gain of 6.6% gain is down to just seven tech titans,“ including Apple, Microsoft, Meta, Alphabet, and Amazon.

The thought of a few companies accounting for so much of the market is jarring, and it’s the kind of thing that you might consider a market vulnerability.
Two quick things: First, there isn’t much evidence that shows a relationship between market concentration and forward market returns (see chart). Second, market concentration isn’t unusual (see this and this).
“AT&T was 13% of total U.S. stock-market value back in 1932; General Motors, 8% in 1928; IBM, 7% in 1970,“ Jason Zweig, a WSJ columnist, wrote a little while back.
These five stocks don’t really represent five companies 🤔
It’s important to recognize today’s market leaders are structurally very different from the one-product companies of the past.
For example, Microsoft isn’t just about Office subscriptions. It’s got a portfolio of massive businesses including consumer products (e.g. Skype), intelligent cloud (Azure), gaming (e.g. Xbox), Bing, and LinkedIn. Microsoft even has a massive billion dollar advertising business.
I’d argue it’s imprecise to characterize FAAMG as five companies. Rather, they represent dozens of multi-billion franchises, which include products and services that permeate our lives in a wide variety of ways.
In the Jan. 30, 2022 TKer, I shared a cheeky disclosure section outlining how I (and maybe you) used these companies’ myriad of offerings. My point was that while I may use an individual product or service increasingly or decreasingly, it would be much more complicated and unlikely that I would separate myself from one of these companies outright.
The bottom line: While the scale of these mega-cap companies may raise eyebrows, their businesses are far more diversified than most, which means concerns about market concentration are arguably overblown.
A quick update on earnings 📈
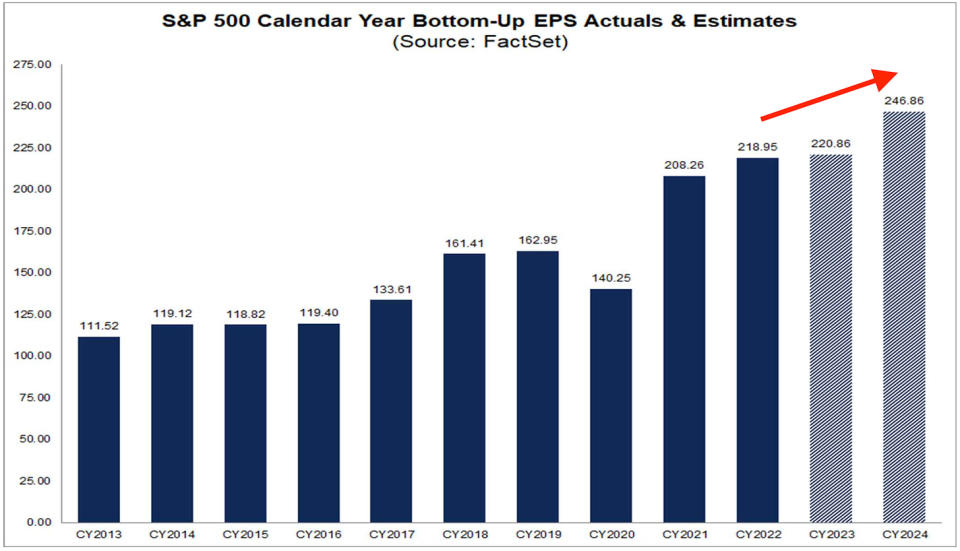
According to updated estimates compiled by FactSet, analysts have revised up their forecasts for S&P 500 earnings per share growth in 2023 and 2024.
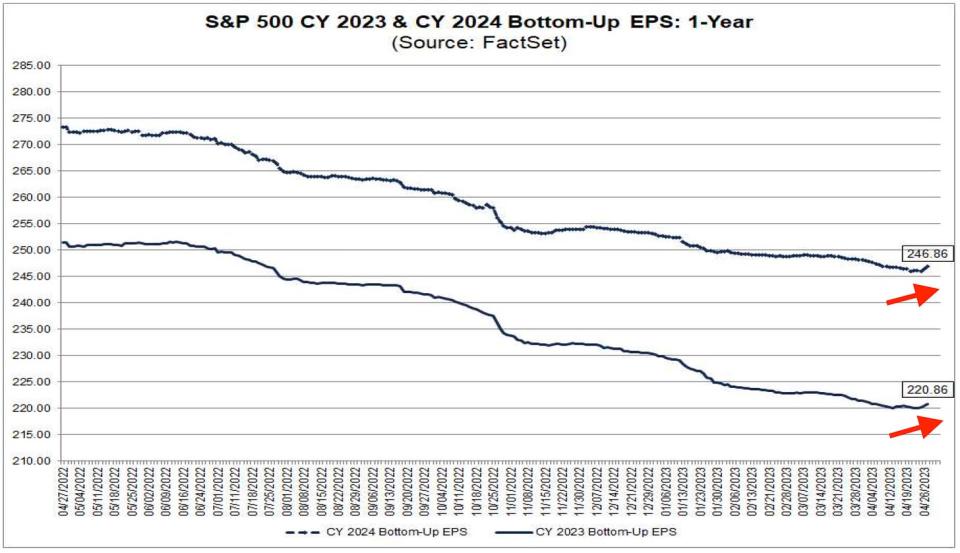
The outlook for growth is modest. Nevertheless, it’s growth.
Reviewing the macro crosscurrents 🔀
There were a few notable data points from last week to consider:
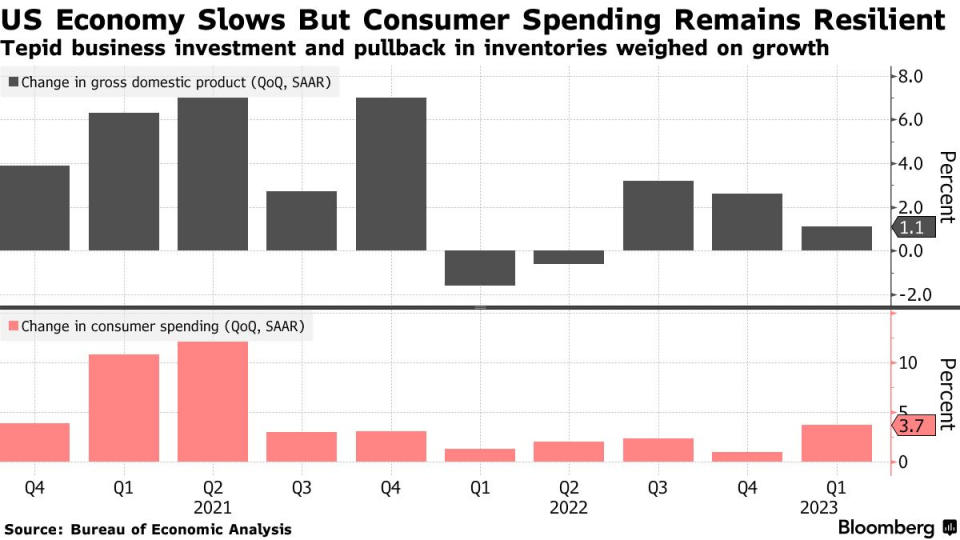
🇺🇸 The U.S. economy grew. U.S. GDP grew at a 1.1% rate during the first three months of this year, according Bureau of Economic Analysis data released Thursday. This included personal spending growth accelerating to 3.7% during the period.
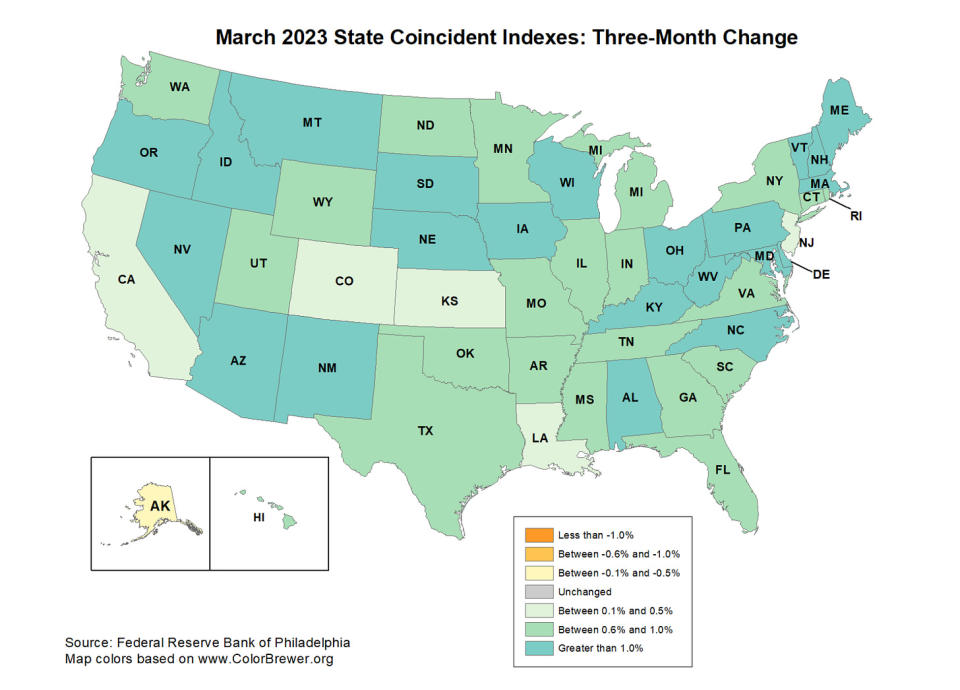
According to the Philly Fed’s State Coincident Indexes, which measures economic activity slightly differently, all 50 U.S. states saw increased economic activity in March. Over the three months through March, activity increased in 49 states and decreased in one.
🛍️ Consumer spending growth cooled. According to BEA data released Friday, personal consumption expenditures increased marginally in month-over-month in March to a record annual rate of $18.1 trillion.

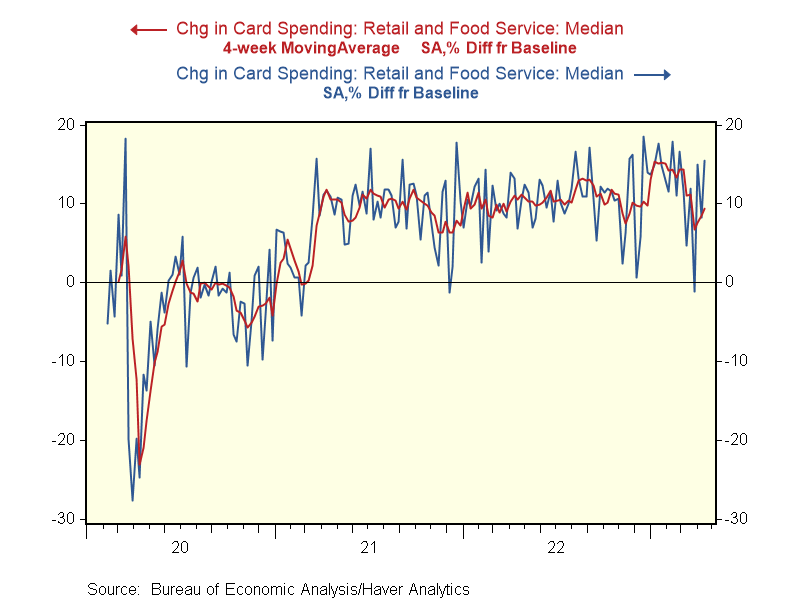
Card spending data suggests spending picked up in April. From Renaissance Macro Research (via Notes): “A slowdown in consumption in March appears to have unwound in April, according to the latest weekly payment card transactions data from the Bureau of Economic Analysis. For the week ending April 18, card spending advanced 15.5% with the four-week moving average running 9.4%.“
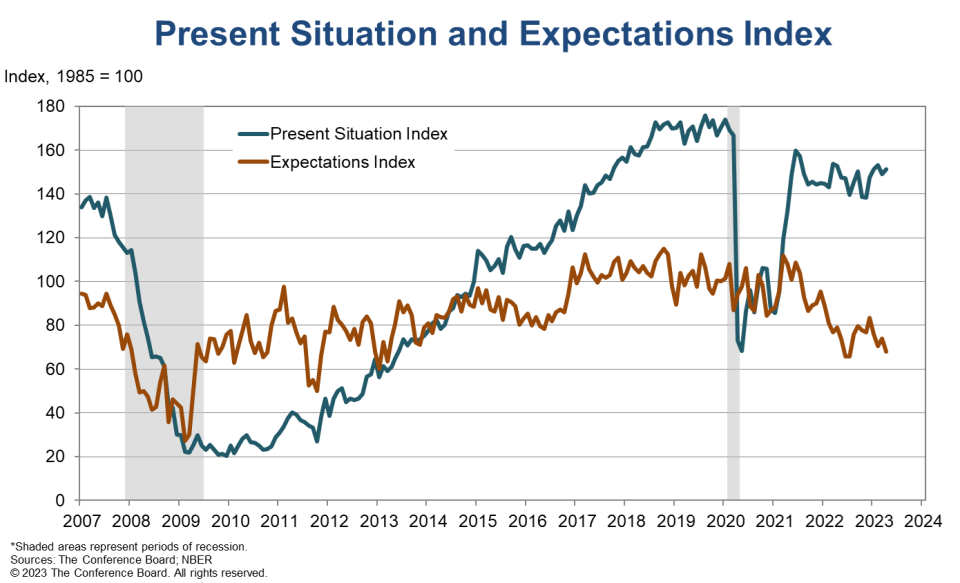
👍 Consumer confidence slips. From The Conference Board (via Notes): “While consumers’ relatively favorable assessment of the current business environment improved somewhat in April, their expectations fell and remain below the level which often signals a recession looming in the short-term… Consumers became more pessimistic about the outlook for both business conditions and labor markets. Compared to last month, fewer households expect business conditions to improve and more expect worsening of conditions in the next six months. They also expect fewer jobs to be available over the short term. April’s decline in consumer confidence reflects particular deterioration in expectations for consumers under 55 years of age and for households earning $50,000 and over.”
For more on how spending activity sometimes conflicts with sentiment, read: A bullish contradiction 🛍.
👍 Labor market confidence improves. From The Conference Board: “Consumers’ appraisal of the labor market improved slightly. 48.4% of consumers said jobs were “plentiful,” up slightly from 47.9%. 11.1% of consumers said jobs were “hard to get,” down slightly from 11.4% last month.“

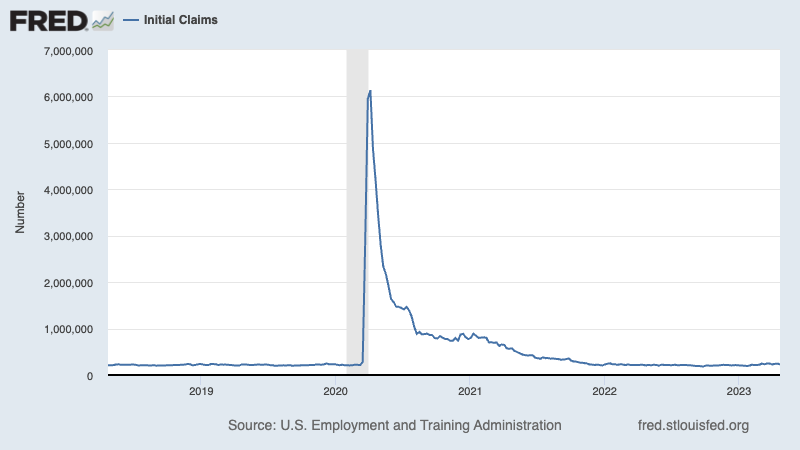
💼 Unemployment claims decline. Initial claims for unemployment benefits fell to 230,000 during the week ending April 22, down from 246,000 the week prior. While the number remains near levels seen during periods of economic expansion, it has been creeping higher in recent months.
🛠️ Business investment cools. Orders for nondefense capital goods excluding aircraft — a.k.a. core capex or business investment — declined 0.4% to $74.3 billion in March.

The backlog of unfilled core capex orders was at $266.5 billion during the month.

For more on slowing activity, read: The glass-half-full view of what could be the next recession 🥃.
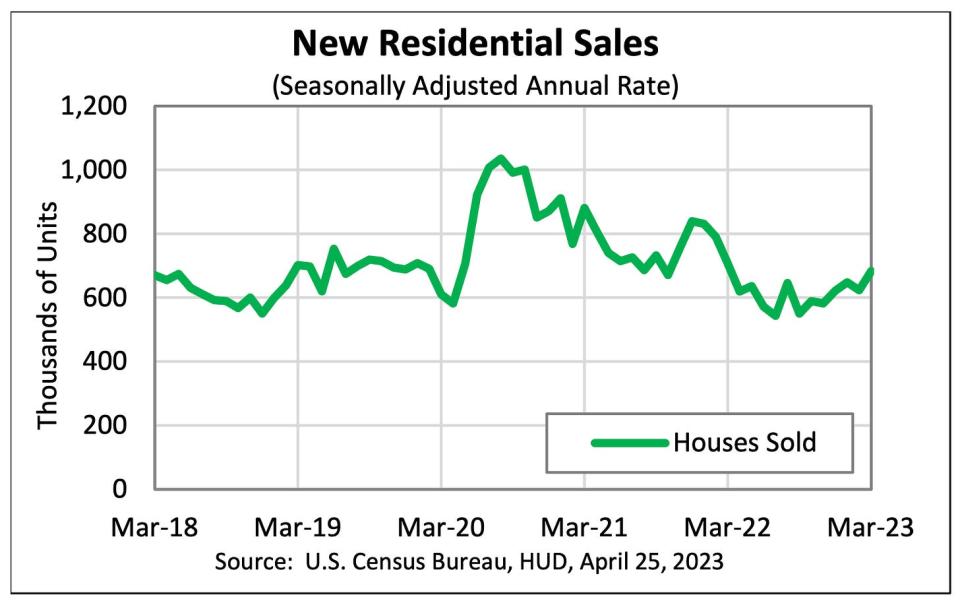
📈 New home sales are up. Sales of newly built homes jumped 9.6% in March to an annualized rate of 683,000 units.
🏠 Home prices tick up. According to the S&P CoreLogic Case-Shiller index, home prices rose 0.2% month-over-month in February, ending a seven-month streak of declines. From SPDJI’s Craig Lazzara: “The results released today pre-date the disruptions in the commercial banking industry which began in early March. Although forecasts are mixed, so far the Federal Reserve seems focused on its inflation reduction targets, which suggests that interest rates may remain elevated, at least in the near-term. Mortgage financing and the prospect of economic weakness are therefore likely to remain a headwind for housing prices for at least the next several months.“

For more on the cooling housing market, read: The U.S. housing market has gone cold 🥶
💵 Labor costs are cooling. The employment cost index in the first quarter was up 4.8% from a year ago, a deceleration from the 5.1% gain in the prior quarter.
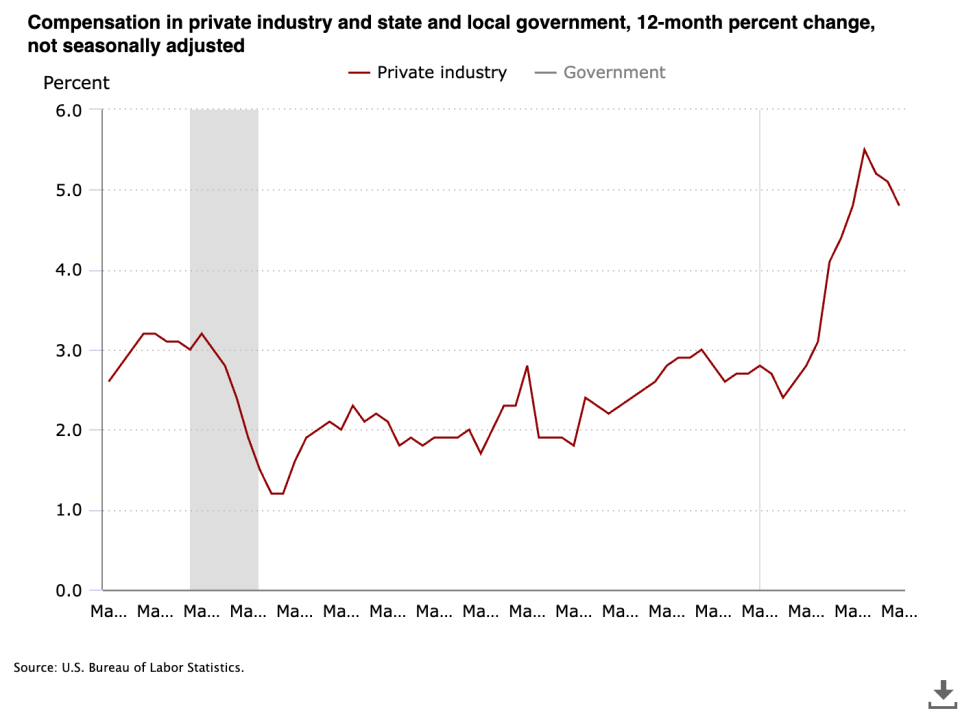
On a quarter over quarter basis, the index was up 1.2% in the first quarter, a slight uptick from the 1.1% rate in the prior quarter.
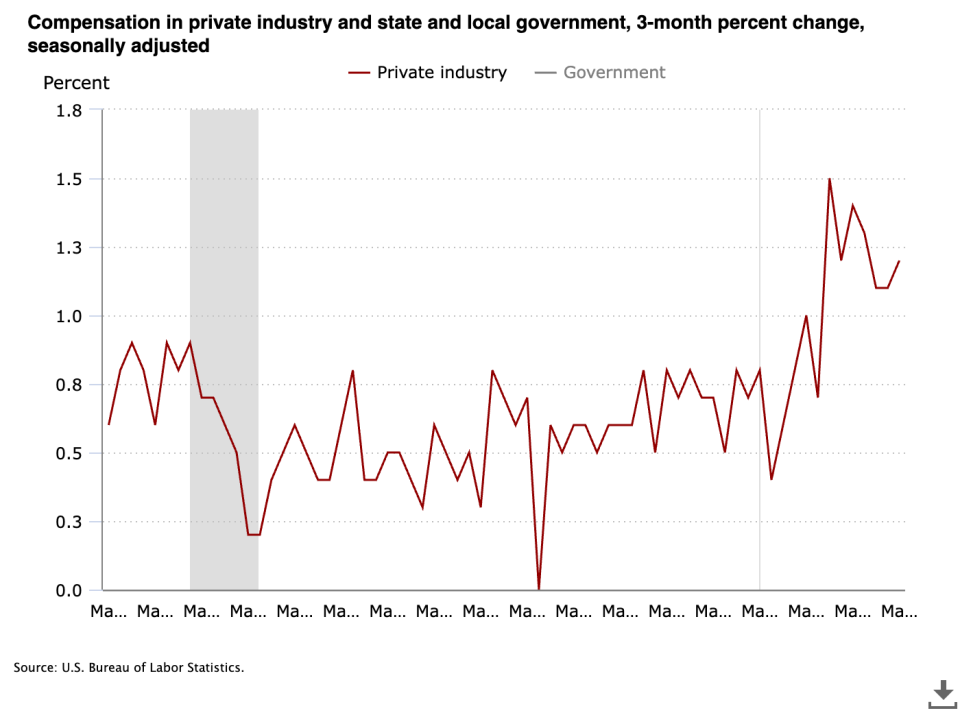
“The 1.2% increase in Q1 puts it squarely in the 1.1%-1.4% range registered over the past seven quarters, a sign the trend in labor costs has yet to convincingly ease,“ Wells Fargo economists wrote.
For more on why the Fed is concerned about high wage growth, read: The complicated mess of the markets and economy, explained 🧩
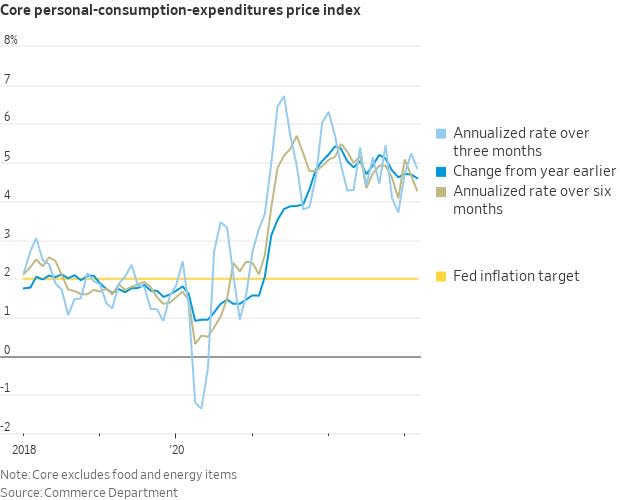
🎈 Inflation is cooling. The personal consumption expenditures (PCE) price index in March was up 4.2 from a year ago, down from the 5.1% increase in Februrary. The core PCE price index — the Federal Reserve’s preferred measure of inflation — was up 4.6% during the month after coming in at 4.7% higher in the prior month.
On a month over month basis, the core PCE price index was up 0.3%. If you annualized the rolling three-month and six-month figures, the core PCE price index was up 4.9% and 4.2%, respectively.
For more on the implications of cooling inflation, read: The bullish 'goldilocks' soft landing scenario that everyone wants 😀.
Putting it all together 🤔
Despite recent banking tumult, we continue to get evidence that we could see a bullish “Goldilocks” soft landing scenario where inflation cools to manageable levels without the economy having to sink into recession.
The Federal Reserve recently adopted a less hawkish tone, acknowledging on February 1 that “for the first time that the disinflationary process has started.“ And on March 22, the Fed signaled that the end of interest rate hikes is near.
In any case, inflation still has to come down more before the Fed is comfortable with price levels. So we should expect the central bank to keep monetary policy tight, which means we should be prepared for tighter financial conditions (e.g. higher interest rates, tighter lending standards, and lower stock valuations).
All of this means the market beatings may continue for the time being, and the risk the economy sinks into a recession will be relatively elevated.
At the same time, it’s important to remember that while recession risks are elevated, consumers are coming from a very strong financial position. Unemployed people are getting jobs. Those with jobs are getting raises. And many still have excess savings to tap into. Indeed, strong spending data confirms this financial resilience. So it’s too early to sound the alarm from a consumption perspective.
At this point, any downturn is unlikely to turn into economic calamity given that the financial health of consumers and businesses remains very strong.
And as always, long-term investors should remember that recessions and bear markets are just part of the deal when you enter the stock market with the aim of generating long-term returns. While markets have had a pretty rough couple of years, the long-run outlook for stocks remains positive.
A version of this post was originally published on TKer.co
Click here for the latest stock market news and in-depth analysis, including events that move stocks
Read the latest financial and business news from Yahoo Finance
