
 Yahoo Finance
 Constellium (NYSE:CSTM) shareholders notch a 19% CAGR over 5 years, yet earnings have been shrinking
When you buy a stock there is always a possibility that it could drop 100%. But on a lighter note, a good company can see its share price rise well over 100%. Long term Constellium SE (NYSE:CSTM) shareholders would be well aware of this, since the stock is up 140% in five years. On top of that, the share price is up 16% in about a quarter. But this could be related to the strong market, which is up 6.4% in the last three months.
The past week has proven to be lucrative for Constellium investors, so let's see if fundamentals drove the company's five-year performance.
Check out our latest analysis for Constellium
To quote Buffett, 'Ships will sail around the world but the Flat Earth Society will flourish. There will continue to be wide discrepancies between price and value in the marketplace...' One flawed but reasonable way to assess how sentiment around a company has changed is to compare the earnings per share (EPS) with the share price.
Constellium's earnings per share are down 14% per year, despite strong share price performance over five years.
This means it's unlikely the market is judging the company based on earnings growth. Since the change in EPS doesn't seem to correlate with the change in share price, it's worth taking a look at other metrics.
On the other hand, Constellium's revenue is growing nicely, at a compound rate of 8.2% over the last five years. In that case, the company may be sacrificing current earnings per share to drive growth.
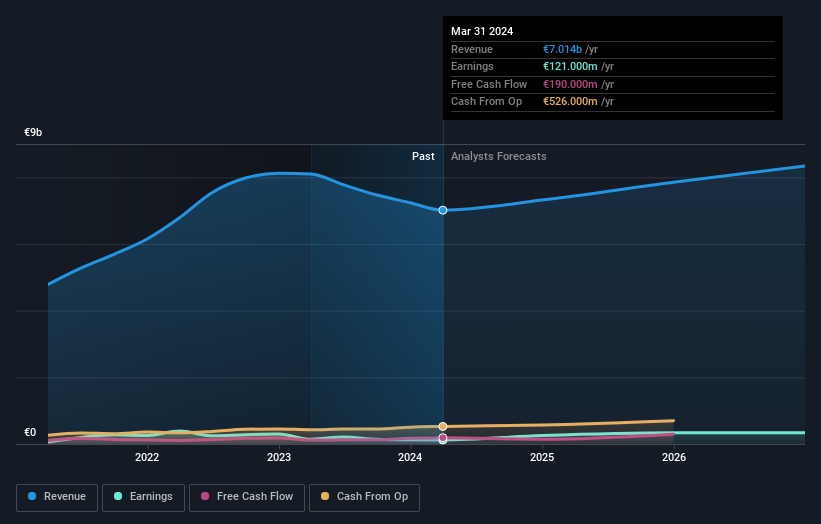
You can see how earnings and revenue have changed over time in the image below (click on the chart to see the exact values).
If you are thinking of buying or selling Constellium stock, you should check out this FREE detailed report on its balance sheet.
A Different Perspective
It's nice to see that Constellium shareholders have received a total shareholder return of 36% over the last year. Since the one-year TSR is better than the five-year TSR (the latter coming in at 19% per year), it would seem that the stock's performance has improved in recent times. Someone with an optimistic perspective could view the recent improvement in TSR as indicating that the business itself is getting better with time. I find it very interesting to look at share price over the long term as a proxy for business performance. But to truly gain insight, we need to consider other information, too. Take risks, for example - Constellium has 1 warning sign we think you should be aware of.
If you are like me, then you will not want to miss this free list of undervalued small caps that insiders are buying.
Please note, the market returns quoted in this article reflect the market weighted average returns of stocks that currently trade on American exchanges.
Have feedback on this article? Concerned about the content? Get in touch with us directly. Alternatively, email editorial-team (at) simplywallst.com.
This article by Simply Wall St is general in nature. We provide commentary based on historical data and analyst forecasts only using an unbiased methodology and our articles are not intended to be financial advice. It does not constitute a recommendation to buy or sell any stock, and does not take account of your objectives, or your financial situation. We aim to bring you long-term focused analysis driven by fundamental data. Note that our analysis may not factor in the latest price-sensitive company announcements or qualitative material. Simply Wall St has no position in any stocks mentioned.
