
 Yahoo Finance
 Cooper Companies' (NASDAQ:COO) investors will be pleased with their notable 35% return over the last five years
When you buy and hold a stock for the long term, you definitely want it to provide a positive return. But more than that, you probably want to see it rise more than the market average. Unfortunately for shareholders, while the The Cooper Companies, Inc. (NASDAQ:COO) share price is up 35% in the last five years, that's less than the market return. Meanwhile, the last twelve months saw the share price rise 1.8%.
Let's take a look at the underlying fundamentals over the longer term, and see if they've been consistent with shareholders returns.
See our latest analysis for Cooper Companies
To paraphrase Benjamin Graham: Over the short term the market is a voting machine, but over the long term it's a weighing machine. One imperfect but simple way to consider how the market perception of a company has shifted is to compare the change in the earnings per share (EPS) with the share price movement.
Cooper Companies' earnings per share are down 4.7% per year, despite strong share price performance over five years.
By glancing at these numbers, we'd posit that the decline in earnings per share is not representative of how the business has changed over the years. Since the change in EPS doesn't seem to correlate with the change in share price, it's worth taking a look at other metrics.
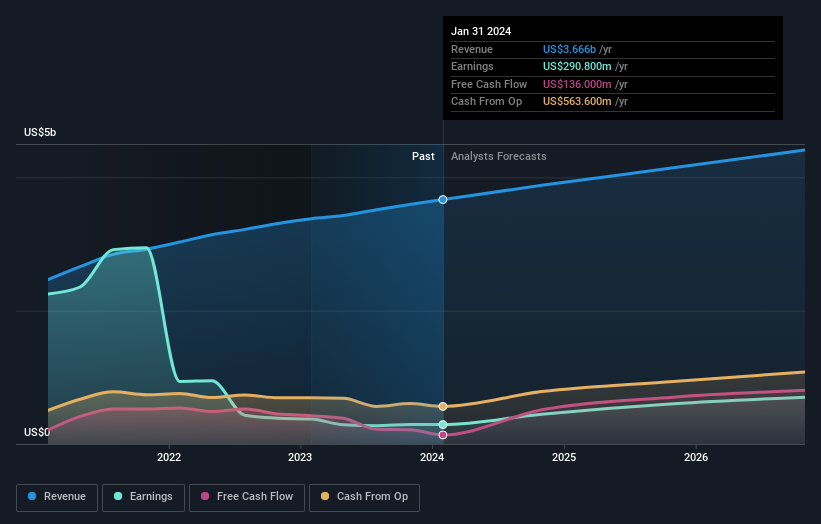
In contrast revenue growth of 8.4% per year is probably viewed as evidence that Cooper Companies is growing, a real positive. In that case, the company may be sacrificing current earnings per share to drive growth.
You can see below how earnings and revenue have changed over time (discover the exact values by clicking on the image).
Cooper Companies is well known by investors, and plenty of clever analysts have tried to predict the future profit levels. If you are thinking of buying or selling Cooper Companies stock, you should check out this free report showing analyst consensus estimates for future profits.
A Different Perspective
Cooper Companies provided a TSR of 1.8% over the last twelve months. Unfortunately this falls short of the market return. It's probably a good sign that the company has an even better long term track record, having provided shareholders with an annual TSR of 6% over five years. It may well be that this is a business worth popping on the watching, given the continuing positive reception, over time, from the market. If you would like to research Cooper Companies in more detail then you might want to take a look at whether insiders have been buying or selling shares in the company.
We will like Cooper Companies better if we see some big insider buys. While we wait, check out this free list of undervalued stocks (mostly small caps) with considerable, recent, insider buying.
Please note, the market returns quoted in this article reflect the market weighted average returns of stocks that currently trade on American exchanges.
Have feedback on this article? Concerned about the content? Get in touch with us directly. Alternatively, email editorial-team (at) simplywallst.com.
This article by Simply Wall St is general in nature. We provide commentary based on historical data and analyst forecasts only using an unbiased methodology and our articles are not intended to be financial advice. It does not constitute a recommendation to buy or sell any stock, and does not take account of your objectives, or your financial situation. We aim to bring you long-term focused analysis driven by fundamental data. Note that our analysis may not factor in the latest price-sensitive company announcements or qualitative material. Simply Wall St has no position in any stocks mentioned.
