
 Yahoo Finance
 Corus Entertainment's (TSE:CJR.B) Returns On Capital Not Reflecting Well On The Business
When we're researching a company, it's sometimes hard to find the warning signs, but there are some financial metrics that can help spot trouble early. A business that's potentially in decline often shows two trends, a return on capital employed (ROCE) that's declining, and a base of capital employed that's also declining. This indicates to us that the business is not only shrinking the size of its net assets, but its returns are falling as well. So after we looked into Corus Entertainment (TSE:CJR.B), the trends above didn't look too great.
Return On Capital Employed (ROCE): What Is It?
For those who don't know, ROCE is a measure of a company's yearly pre-tax profit (its return), relative to the capital employed in the business. Analysts use this formula to calculate it for Corus Entertainment:
Return on Capital Employed = Earnings Before Interest and Tax (EBIT) ÷ (Total Assets - Current Liabilities)
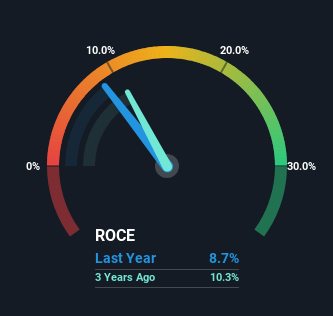
0.087 = CA$179m ÷ (CA$2.7b - CA$587m) (Based on the trailing twelve months to February 2024).
Therefore, Corus Entertainment has an ROCE of 8.7%. On its own, that's a low figure but it's around the 10% average generated by the Media industry.
View our latest analysis for Corus Entertainment
In the above chart we have measured Corus Entertainment's prior ROCE against its prior performance, but the future is arguably more important. If you'd like to see what analysts are forecasting going forward, you should check out our free analyst report for Corus Entertainment .
So How Is Corus Entertainment's ROCE Trending?
The trend of returns that Corus Entertainment is generating are raising some concerns. Unfortunately, returns have declined substantially over the last five years to the 8.7% we see today. What's equally concerning is that the amount of capital deployed in the business has shrunk by 52% over that same period. The fact that both are shrinking is an indication that the business is going through some tough times. Typically businesses that exhibit these characteristics aren't the ones that tend to multiply over the long term, because statistically speaking, they've already gone through the growth phase of their life cycle.
While on the subject, we noticed that the ratio of current liabilities to total assets has risen to 22%, which has impacted the ROCE. If current liabilities hadn't increased as much as they did, the ROCE could actually be even lower. While the ratio isn't currently too high, it's worth keeping an eye on this because if it gets particularly high, the business could then face some new elements of risk.
The Bottom Line
To see Corus Entertainment reducing the capital employed in the business in tandem with diminishing returns, is concerning. We expect this has contributed to the stock plummeting 90% during the last five years. Unless there is a shift to a more positive trajectory in these metrics, we would look elsewhere.
Corus Entertainment does have some risks, we noticed 2 warning signs (and 1 which makes us a bit uncomfortable) we think you should know about.
While Corus Entertainment isn't earning the highest return, check out this free list of companies that are earning high returns on equity with solid balance sheets.
Have feedback on this article? Concerned about the content? Get in touch with us directly. Alternatively, email editorial-team (at) simplywallst.com.
This article by Simply Wall St is general in nature. We provide commentary based on historical data and analyst forecasts only using an unbiased methodology and our articles are not intended to be financial advice. It does not constitute a recommendation to buy or sell any stock, and does not take account of your objectives, or your financial situation. We aim to bring you long-term focused analysis driven by fundamental data. Note that our analysis may not factor in the latest price-sensitive company announcements or qualitative material. Simply Wall St has no position in any stocks mentioned.
