
 Yahoo Finance
 Could The Graco Inc. (NYSE:GGG) Ownership Structure Tell Us Something Useful?

If you want to know who really controls Graco Inc. (NYSE:GGG), then you'll have to look at the makeup of its share registry. Large companies usually have institutions as shareholders, and we usually see insiders owning shares in smaller companies. Companies that have been privatized tend to have low insider ownership.
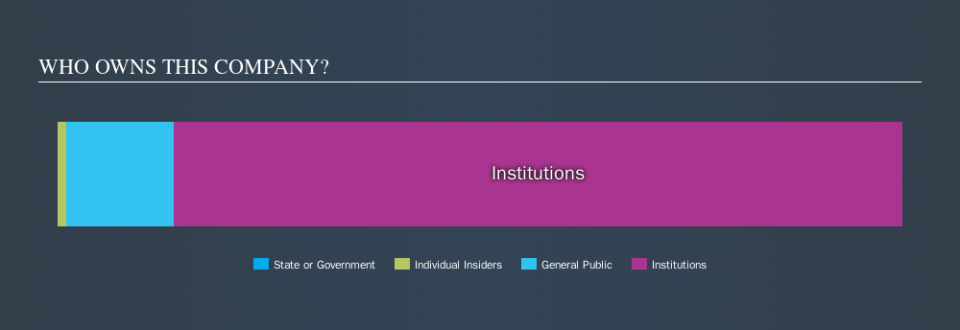
Graco is a pretty big company. It has a market capitalization of US$7.6b. Normally institutions would own a significant portion of a company this size. Taking a look at our data on the ownership groups (below), it's seems that institutions are noticeable on the share registry. Let's take a closer look to see what the different types of shareholder can tell us about GGG.
View our latest analysis for Graco
What Does The Institutional Ownership Tell Us About Graco?
Institutional investors commonly compare their own returns to the returns of a commonly followed index. So they generally do consider buying larger companies that are included in the relevant benchmark index.
As you can see, institutional investors own 86% of Graco. This implies the analysts working for those institutions have looked at the stock and they like it. But just like anyone else, they could be wrong. If multiple institutions change their view on a stock at the same time, you could see the share price drop fast. It's therefore worth looking at Graco's earnings history, below. Of course, the future is what really matters.

Investors should note that institutions actually own more than half the company, so they can collectively wield significant power. We note that hedge funds don't have a meaningful investment in Graco. There are plenty of analysts covering the stock, so it might be worth seeing what they are forecasting, too.
Insider Ownership Of Graco
While the precise definition of an insider can be subjective, almost everyone considers board members to be insiders. Management ultimately answers to the board. However, it is not uncommon for managers to be executive board members, especially if they are a founder or the CEO.
Most consider insider ownership a positive because it can indicate the board is well aligned with other shareholders. However, on some occasions too much power is concentrated within this group.
Our most recent data indicates that insiders own some shares in Graco Inc.. The insiders have a meaningful stake worth US$85m. Most would see this as a real positive. Most would say this shows alignment of interests between shareholders and the board. Still, it might be worth checking if those insiders have been selling.
General Public Ownership
The general public, with a 13% stake in the company, will not easily be ignored. While this group can't necessarily call the shots, it can certainly have a real influence on how the company is run.
Next Steps:
While it is well worth considering the different groups that own a company, there are other factors that are even more important.
I like to dive deeper into how a company has performed in the past. You can access this interactive graph of past earnings, revenue and cash flow, for free.
If you would prefer discover what analysts are predicting in terms of future growth, do not miss this free report on analyst forecasts.
NB: Figures in this article are calculated using data from the last twelve months, which refer to the 12-month period ending on the last date of the month the financial statement is dated. This may not be consistent with full year annual report figures.
We aim to bring you long-term focused research analysis driven by fundamental data. Note that our analysis may not factor in the latest price-sensitive company announcements or qualitative material.
If you spot an error that warrants correction, please contact the editor at editorial-team@simplywallst.com. This article by Simply Wall St is general in nature. It does not constitute a recommendation to buy or sell any stock, and does not take account of your objectives, or your financial situation. Simply Wall St has no position in the stocks mentioned. Thank you for reading.
