
 Yahoo Finance
 Declining Stock and Decent Financials: Is The Market Wrong About Steadfast Group Limited (ASX:SDF)?
With its stock down 3.0% over the past three months, it is easy to disregard Steadfast Group (ASX:SDF). However, the company's fundamentals look pretty decent, and long-term financials are usually aligned with future market price movements. Particularly, we will be paying attention to Steadfast Group's ROE today.
Return on equity or ROE is an important factor to be considered by a shareholder because it tells them how effectively their capital is being reinvested. In simpler terms, it measures the profitability of a company in relation to shareholder's equity.
View our latest analysis for Steadfast Group
How Do You Calculate Return On Equity?
ROE can be calculated by using the formula:
Return on Equity = Net Profit (from continuing operations) ÷ Shareholders' Equity
So, based on the above formula, the ROE for Steadfast Group is:
9.7% = AU$247m ÷ AU$2.5b (Based on the trailing twelve months to December 2023).
The 'return' is the yearly profit. One way to conceptualize this is that for each A$1 of shareholders' capital it has, the company made A$0.10 in profit.
What Has ROE Got To Do With Earnings Growth?
Thus far, we have learned that ROE measures how efficiently a company is generating its profits. We now need to evaluate how much profit the company reinvests or "retains" for future growth which then gives us an idea about the growth potential of the company. Assuming all else is equal, companies that have both a higher return on equity and higher profit retention are usually the ones that have a higher growth rate when compared to companies that don't have the same features.
Steadfast Group's Earnings Growth And 9.7% ROE
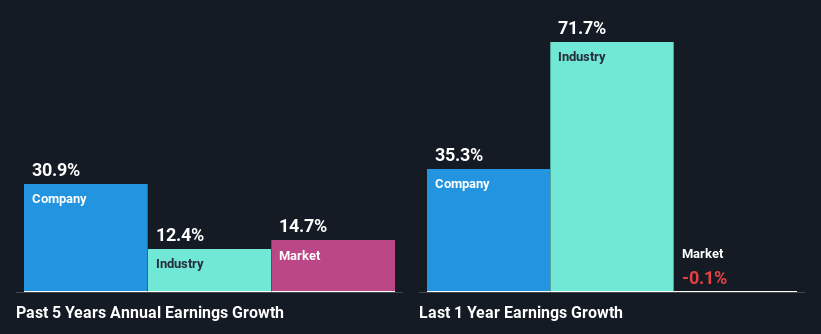
On the face of it, Steadfast Group's ROE is not much to talk about. A quick further study shows that the company's ROE doesn't compare favorably to the industry average of 13% either. Despite this, surprisingly, Steadfast Group saw an exceptional 31% net income growth over the past five years. So, there might be other aspects that are positively influencing the company's earnings growth. For instance, the company has a low payout ratio or is being managed efficiently.
As a next step, we compared Steadfast Group's net income growth with the industry, and pleasingly, we found that the growth seen by the company is higher than the average industry growth of 12%.
Earnings growth is an important metric to consider when valuing a stock. It’s important for an investor to know whether the market has priced in the company's expected earnings growth (or decline). This then helps them determine if the stock is placed for a bright or bleak future. What is SDF worth today? The intrinsic value infographic in our free research report helps visualize whether SDF is currently mispriced by the market.
Is Steadfast Group Using Its Retained Earnings Effectively?
The high three-year median payout ratio of 81% (implying that it keeps only 19% of profits) for Steadfast Group suggests that the company's growth wasn't really hampered despite it returning most of the earnings to its shareholders.
Moreover, Steadfast Group is determined to keep sharing its profits with shareholders which we infer from its long history of paying a dividend for at least ten years. Our latest analyst data shows that the future payout ratio of the company is expected to drop to 64% over the next three years. As a result, the expected drop in Steadfast Group's payout ratio explains the anticipated rise in the company's future ROE to 13%, over the same period.
Conclusion
In total, it does look like Steadfast Group has some positive aspects to its business. Namely, its high earnings growth. We do however feel that the earnings growth number could have been even higher, had the company been reinvesting more of its earnings and paid out less dividends. That being so, a study of the latest analyst forecasts show that the company is expected to see a slowdown in its future earnings growth. To know more about the latest analysts predictions for the company, check out this visualization of analyst forecasts for the company.
Have feedback on this article? Concerned about the content? Get in touch with us directly. Alternatively, email editorial-team (at) simplywallst.com.
This article by Simply Wall St is general in nature. We provide commentary based on historical data and analyst forecasts only using an unbiased methodology and our articles are not intended to be financial advice. It does not constitute a recommendation to buy or sell any stock, and does not take account of your objectives, or your financial situation. We aim to bring you long-term focused analysis driven by fundamental data. Note that our analysis may not factor in the latest price-sensitive company announcements or qualitative material. Simply Wall St has no position in any stocks mentioned.
