
 Yahoo Finance
 Did Changing Sentiment Drive Crescent Point Energy's (TSE:CPG) Share Price Down A Painful 79%?

While it may not be enough for some shareholders, we think it is good to see the Crescent Point Energy Corp. (TSE:CPG) share price up 17% in a single quarter. But will that repair the damage for the weary investors who have owned this stock as it declined over half a decade? Probably not. Like a ship taking on water, the share price has sunk 79% in that time. So we don't gain too much confidence from the recent recovery. The real question is whether the business can leave its past behind and improve itself over the years ahead.
View our latest analysis for Crescent Point Energy
Crescent Point Energy isn't currently profitable, so most analysts would look to revenue growth to get an idea of how fast the underlying business is growing. Shareholders of unprofitable companies usually expect strong revenue growth. As you can imagine, fast revenue growth, when maintained, often leads to fast profit growth.
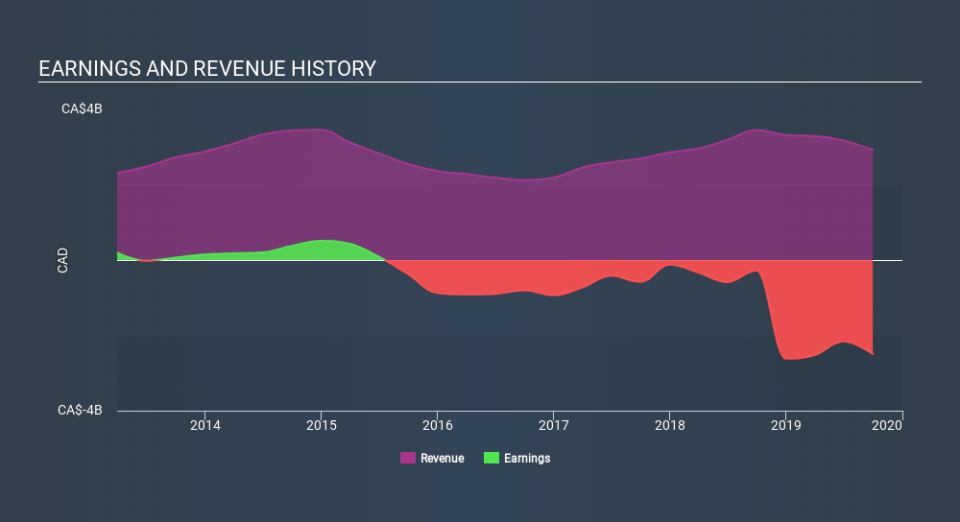
Over five years, Crescent Point Energy grew its revenue at 2.3% per year. That's far from impressive given all the money it is losing. It's not so sure that share price crash of 27% per year is completely deserved, but the market is doubtless disappointed. While we're definitely wary of the stock, after that kind of performance, it could be an over-reaction. We'd recommend focussing any further research on the likelihood of profitability in the foreseeable future, given the muted revenue growth.
The graphic below depicts how earnings and revenue have changed over time (unveil the exact values by clicking on the image).
Balance sheet strength is crucial. It might be well worthwhile taking a look at our free report on how its financial position has changed over time.
What About Dividends?
When looking at investment returns, it is important to consider the difference between total shareholder return (TSR) and share price return. The TSR incorporates the value of any spin-offs or discounted capital raisings, along with any dividends, based on the assumption that the dividends are reinvested. It's fair to say that the TSR gives a more complete picture for stocks that pay a dividend. In the case of Crescent Point Energy, it has a TSR of -75% for the last 5 years. That exceeds its share price return that we previously mentioned. This is largely a result of its dividend payments!
A Different Perspective
We're pleased to report that Crescent Point Energy shareholders have received a total shareholder return of 34% over one year. And that does include the dividend. There's no doubt those recent returns are much better than the TSR loss of 24% per year over five years. The long term loss makes us cautious, but the short term TSR gain certainly hints at a brighter future. Most investors take the time to check the data on insider transactions. You can click here to see if insiders have been buying or selling.
If you like to buy stocks alongside management, then you might just love this free list of companies. (Hint: insiders have been buying them).
Please note, the market returns quoted in this article reflect the market weighted average returns of stocks that currently trade on CA exchanges.
If you spot an error that warrants correction, please contact the editor at editorial-team@simplywallst.com. This article by Simply Wall St is general in nature. It does not constitute a recommendation to buy or sell any stock, and does not take account of your objectives, or your financial situation. Simply Wall St has no position in the stocks mentioned.
We aim to bring you long-term focused research analysis driven by fundamental data. Note that our analysis may not factor in the latest price-sensitive company announcements or qualitative material. Thank you for reading.
