
 Yahoo Finance
 Did You Manage To Avoid National Grid's (LON:NG.) 22% Share Price Drop?

Want to participate in a short research study? Help shape the future of investing tools and you could win a $250 gift card!
For many investors, the main point of stock picking is to generate higher returns than the overall market. But its virtually certain that sometimes you will buy stocks that fall short of the market average returns. We regret to report that long term National Grid plc (LON:NG.) shareholders have had that experience, with the share price dropping 22% in three years, versus a market return of about 30%. The good news is that the stock is up 1.9% in the last week.
Check out our latest analysis for National Grid
While the efficient markets hypothesis continues to be taught by some, it has been proven that markets are over-reactive dynamic systems, and investors are not always rational. By comparing earnings per share (EPS) and share price changes over time, we can get a feel for how investor attitudes to a company have morphed over time.
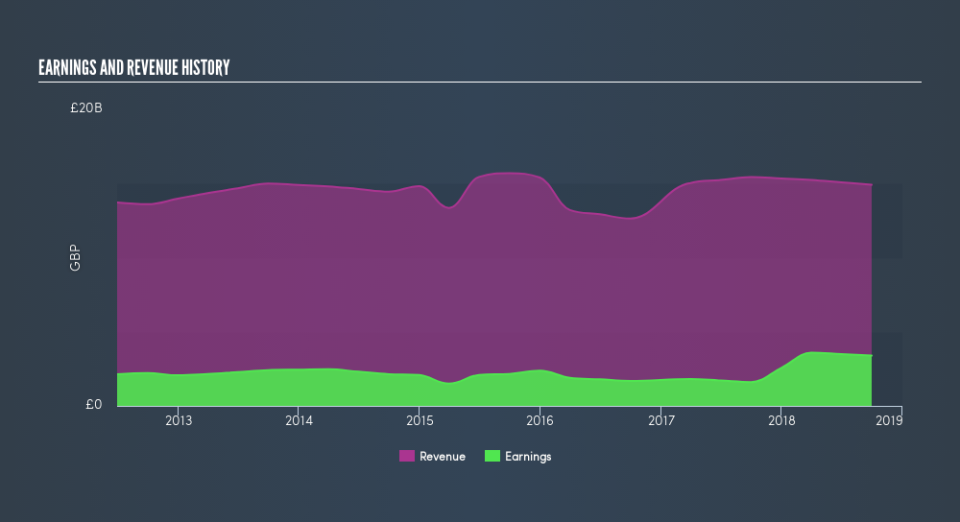
During the unfortunate three years of share price decline, National Grid actually saw its earnings per share (EPS) improve by 17% per year. This is quite a puzzle, and suggests there might be something temporarily buoying the share price. Or else the company was over-hyped in the past, and so its growth has disappointed. Since the change in EPS doesn't seem to correlate with the change in share price, it's worth taking a look at other metrics.
It's quite likely that the declining dividend has caused some investors to sell their shares, pushing the price lower in the process. It doesn't seem like the changes in revenue would have impacted the share price much, but a closer inspection of the data might reveal something.
You can see how revenue and earnings have changed over time in the image below, (click on the chart to see cashflow).
National Grid is a well known stock, with plenty of analyst coverage, suggesting some visibility into future growth. Given we have quite a good number of analyst forecasts, it might be well worth checking out this free chart depicting consensus estimates.
What About Dividends?
As well as measuring the share price return, investors should also consider the total shareholder return (TSR). The TSR incorporates the value of any spin-offs or discounted capital raisings, along with any dividends, based on the assumption that the dividends are reinvested. So for companies that pay a generous dividend, the TSR is often a lot higher than the share price return. As it happens, National Grid's TSR for the last 3 years was -1.8%, which exceeds the share price return mentioned earlier. This is largely a result of its dividend payments!
A Different Perspective
It's good to see that National Grid has rewarded shareholders with a total shareholder return of 7.3% in the last twelve months. That's including the dividend. That's better than the annualised return of 4.2% over half a decade, implying that the company is doing better recently. In the best case scenario, this may hint at some real business momentum, implying that now could be a great time to delve deeper. Importantly, we haven't analysed National Grid's dividend history. This free visual report on its dividends is a must-read if you're thinking of buying.
Of course, you might find a fantastic investment by looking elsewhere. So take a peek at this free list of companies we expect will grow earnings.
Please note, the market returns quoted in this article reflect the market weighted average returns of stocks that currently trade on GB exchanges.
We aim to bring you long-term focused research analysis driven by fundamental data. Note that our analysis may not factor in the latest price-sensitive company announcements or qualitative material.
If you spot an error that warrants correction, please contact the editor at editorial-team@simplywallst.com. This article by Simply Wall St is general in nature. It does not constitute a recommendation to buy or sell any stock, and does not take account of your objectives, or your financial situation. Simply Wall St has no position in the stocks mentioned. Thank you for reading.
