
 Yahoo Finance
 Did You Manage To Avoid Technogym's (BIT:TGYM) 36% Share Price Drop?

Technogym S.p.A. (BIT:TGYM) shareholders should be happy to see the share price up 20% in the last week. But that doesn't change the reality of under-performance over the last twelve months. The cold reality is that the stock has dropped 36% in one year, under-performing the market.
Check out our latest analysis for Technogym
While markets are a powerful pricing mechanism, share prices reflect investor sentiment, not just underlying business performance. One flawed but reasonable way to assess how sentiment around a company has changed is to compare the earnings per share (EPS) with the share price.
Unfortunately Technogym reported an EPS drop of 11% for the last year. The share price decline of 36% is actually more than the EPS drop. This suggests the EPS fall has made some shareholders are more nervous about the business.
You can see how EPS has changed over time in the image below (click on the chart to see the exact values).
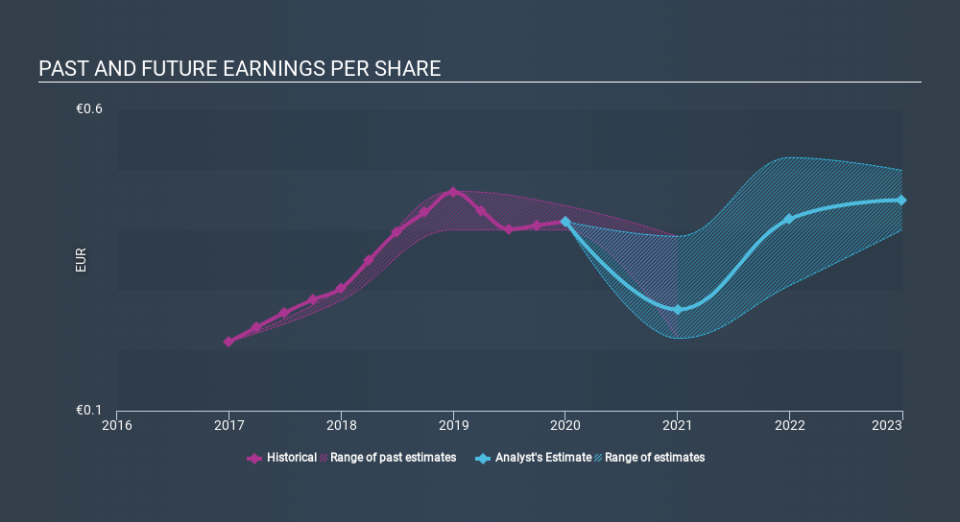
Dive deeper into Technogym's key metrics by checking this interactive graph of Technogym's earnings, revenue and cash flow.
What about the Total Shareholder Return (TSR)?
Investors should note that there's a difference between Technogym's total shareholder return (TSR) and its share price change, which we've covered above. The TSR is a return calculation that accounts for the value of cash dividends (assuming that any dividend received was reinvested) and the calculated value of any discounted capital raisings and spin-offs. Its history of dividend payouts mean that Technogym's TSR, which was a 35% drop over the last year, was not as bad as the share price return.
A Different Perspective
The last twelve months weren't great for Technogym shares, which performed worse than the market, costing holders 35%. Meanwhile, the broader market slid about 17%, likely weighing on the stock. Investors are up over three years, booking 0.8% per year, much better than the more recent returns. Sometimes when a good quality long term winner has a weak period, it's turns out to be an opportunity, but you really need to be sure that the quality is there. While it is well worth considering the different impacts that market conditions can have on the share price, there are other factors that are even more important. Even so, be aware that Technogym is showing 1 warning sign in our investment analysis , you should know about...
Of course Technogym may not be the best stock to buy. So you may wish to see this free collection of growth stocks.
Please note, the market returns quoted in this article reflect the market weighted average returns of stocks that currently trade on IT exchanges.
If you spot an error that warrants correction, please contact the editor at editorial-team@simplywallst.com. This article by Simply Wall St is general in nature. It does not constitute a recommendation to buy or sell any stock, and does not take account of your objectives, or your financial situation. Simply Wall St has no position in the stocks mentioned.
We aim to bring you long-term focused research analysis driven by fundamental data. Note that our analysis may not factor in the latest price-sensitive company announcements or qualitative material. Thank you for reading.
