
 Yahoo Finance
 Did Transurban Group's (ASX:TCL) Share Price Deserve to Gain 22%?
Thanks in no small measure to Vanguard founder Jack Bogle, it's easy buy a low cost index fund, which should provide the average market return. But you can make better returns by buying undervalued shares. To wit, Transurban Group (ASX:TCL) shares are up 22% in three years, besting the market return. More recently the stock has gained 7.3% in a year, which isn't too bad.
See our latest analysis for Transurban Group
There is no denying that markets are sometimes efficient, but prices do not always reflect underlying business performance. One way to examine how market sentiment has changed over time is to look at the interaction between a company's share price and its earnings per share (EPS).
Over the last three years, Transurban Group failed to grow earnings per share, which fell 109% (annualized).
This means it's unlikely the market is judging the company based on earnings growth. Since the change in EPS doesn't seem to correlate with the change in share price, it's worth taking a look at other metrics.
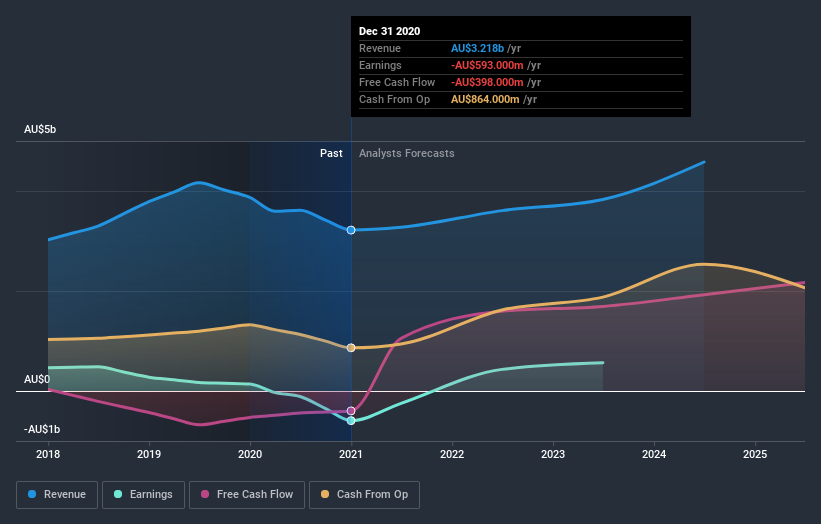
Do you think that shareholders are buying for the 2.5% per annum revenue growth trend? We don't. So truth be told we can't see an easy explanation for the share price action, but perhaps you can...
You can see how earnings and revenue have changed over time in the image below (click on the chart to see the exact values).
It's probably worth noting we've seen significant insider buying in the last quarter, which we consider a positive. That said, we think earnings and revenue growth trends are even more important factors to consider. So it makes a lot of sense to check out what analysts think Transurban Group will earn in the future (free profit forecasts).
What About Dividends?
As well as measuring the share price return, investors should also consider the total shareholder return (TSR). Whereas the share price return only reflects the change in the share price, the TSR includes the value of dividends (assuming they were reinvested) and the benefit of any discounted capital raising or spin-off. It's fair to say that the TSR gives a more complete picture for stocks that pay a dividend. In the case of Transurban Group, it has a TSR of 38% for the last 3 years. That exceeds its share price return that we previously mentioned. This is largely a result of its dividend payments!
A Different Perspective
Transurban Group provided a TSR of 9.7% over the last twelve months. But that was short of the market average. The silver lining is that the gain was actually better than the average annual return of 8% per year over five year. This suggests the company might be improving over time. While it is well worth considering the different impacts that market conditions can have on the share price, there are other factors that are even more important. Take risks, for example - Transurban Group has 2 warning signs we think you should be aware of.
There are plenty of other companies that have insiders buying up shares. You probably do not want to miss this free list of growing companies that insiders are buying.
Please note, the market returns quoted in this article reflect the market weighted average returns of stocks that currently trade on AU exchanges.
This article by Simply Wall St is general in nature. It does not constitute a recommendation to buy or sell any stock, and does not take account of your objectives, or your financial situation. We aim to bring you long-term focused analysis driven by fundamental data. Note that our analysis may not factor in the latest price-sensitive company announcements or qualitative material. Simply Wall St has no position in any stocks mentioned.
Have feedback on this article? Concerned about the content? Get in touch with us directly. Alternatively, email editorial-team (at) simplywallst.com.
