
 Yahoo Finance
 How Did Zurich Insurance Group AG’s (VTX:ZURN) 11.4% ROE Fare Against The Industry?

This analysis is intended to introduce important early concepts to people who are starting to invest and want to start learning about core concepts of fundamental analysis on practical examples from today’s market.
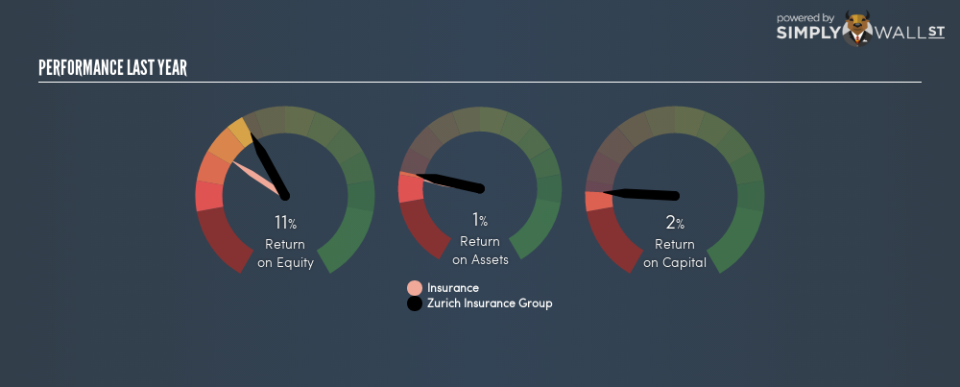
Zurich Insurance Group AG (VTX:ZURN) delivered an ROE of 11.4% over the past 12 months, which is an impressive feat relative to its industry average of 7.0% during the same period. While the impressive ratio tells us that ZURN has made significant profits from little equity capital, ROE doesn’t tell us if ZURN has borrowed debt to make this happen. Today, we’ll take a closer look at some factors like financial leverage to see how sustainable ZURN’s ROE is.
See our latest analysis for Zurich Insurance Group
Peeling the layers of ROE – trisecting a company’s profitability
Firstly, Return on Equity, or ROE, is simply the percentage of last years’ earning against the book value of shareholders’ equity. An ROE of 11.4% implies CHF0.11 returned on every CHF1 invested. While a higher ROE is preferred in most cases, there are several other factors we should consider before drawing any conclusions.
Return on Equity = Net Profit ÷ Shareholders Equity
ROE is assessed against cost of equity, which is measured using the Capital Asset Pricing Model (CAPM) – but let’s not dive into the details of that today. For now, let’s just look at the cost of equity number for Zurich Insurance Group, which is 8.7%. Since Zurich Insurance Group’s return covers its cost in excess of 2.7%, its use of equity capital is efficient and likely to be sustainable. Simply put, Zurich Insurance Group pays less for its capital than what it generates in return. ROE can be broken down into three different ratios: net profit margin, asset turnover, and financial leverage. This is called the Dupont Formula:
Dupont Formula
ROE = profit margin × asset turnover × financial leverage
ROE = (annual net profit ÷ sales) × (sales ÷ assets) × (assets ÷ shareholders’ equity)
ROE = annual net profit ÷ shareholders’ equity
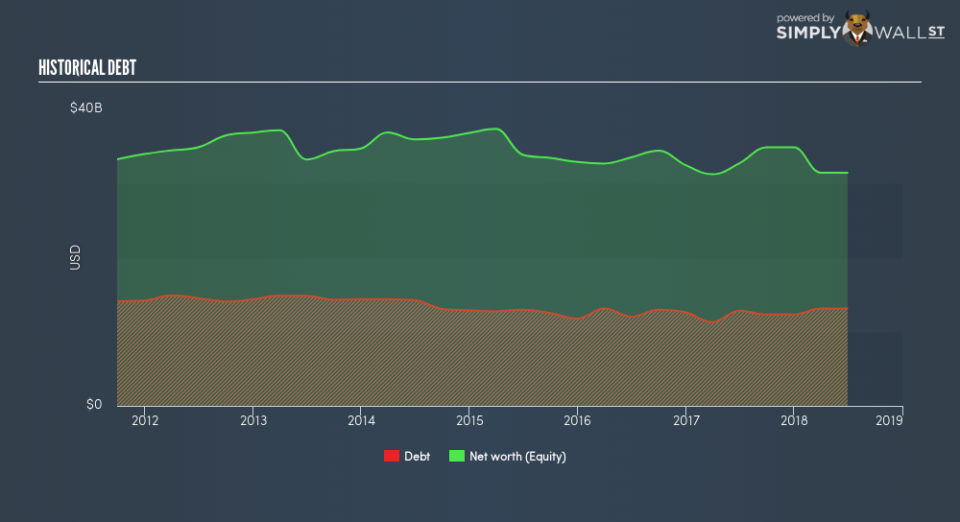
The first component is profit margin, which measures how much of sales is retained after the company pays for all its expenses. Asset turnover shows how much revenue Zurich Insurance Group can generate with its current asset base. The most interesting ratio, and reflective of sustainability of its ROE, is financial leverage. Since ROE can be artificially increased through excessive borrowing, we should check Zurich Insurance Group’s historic debt-to-equity ratio. Currently the debt-to-equity ratio stands at a low 41.7%, which means its above-average ROE is driven by its ability to grow its profit without a significant debt burden.
Next Steps:
ROE is a simple yet informative ratio, illustrating the various components that each measure the quality of the overall stock. Zurich Insurance Group’s ROE is impressive relative to the industry average and also covers its cost of equity. ROE is not likely to be inflated by excessive debt funding, giving shareholders more conviction in the sustainability of high returns. ROE is a helpful signal, but it is definitely not sufficient on its own to make an investment decision.
For Zurich Insurance Group, I’ve compiled three important aspects you should further research:
Financial Health: Does it have a healthy balance sheet? Take a look at our free balance sheet analysis with six simple checks on key factors like leverage and risk.
Valuation: What is Zurich Insurance Group worth today? Is the stock undervalued, even when its growth outlook is factored into its intrinsic value? The intrinsic value infographic in our free research report helps visualize whether Zurich Insurance Group is currently mispriced by the market.
Other High-Growth Alternatives : Are there other high-growth stocks you could be holding instead of Zurich Insurance Group? Explore our interactive list of stocks with large growth potential to get an idea of what else is out there you may be missing!
To help readers see past the short term volatility of the financial market, we aim to bring you a long-term focused research analysis purely driven by fundamental data. Note that our analysis does not factor in the latest price-sensitive company announcements.
The author is an independent contributor and at the time of publication had no position in the stocks mentioned. For errors that warrant correction please contact the editor at editorial-team@simplywallst.com.
