
 Yahoo Finance
 Does The artnet AG (ETR:ART) Share Price Fall With The Market?

Anyone researching artnet AG (ETR:ART) might want to consider the historical volatility of the share price. Volatility is considered to be a measure of risk in modern finance theory. Investors may think of volatility as falling into two main categories. The first category is company specific volatility. This can be dealt with by limiting your exposure to any particular stock. The second type is the broader market volatility, which you cannot diversify away, since it arises from macroeconomic factors which directly affects all the stocks on the market.
Some stocks mimic the volatility of the market quite closely, while others demonstrate muted, exagerrated or uncorrelated price movements. Beta is a widely used metric to measure a stock's exposure to market risk (volatility). Before we go on, it's worth noting that Warren Buffett pointed out in his 2014 letter to shareholders that 'volatility is far from synonymous with risk.' Having said that, beta can still be rather useful. The first thing to understand about beta is that the beta of the overall market is one. A stock with a beta greater than one is more sensitive to broader market movements than a stock with a beta of less than one.
See our latest analysis for artnet
What does ART's beta value mean to investors?
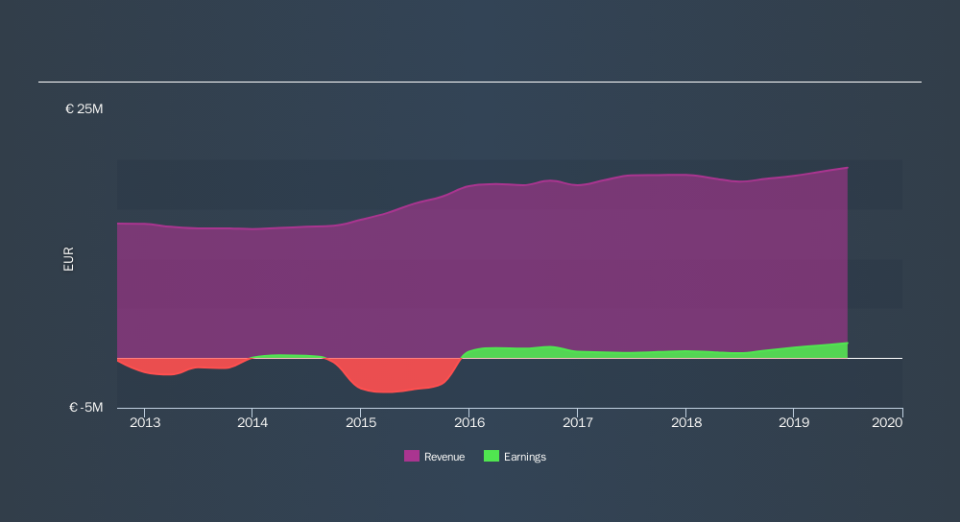
Looking at the last five years, artnet has a beta of 1.42. The fact that this is well above 1 indicates that its share price movements have shown sensitivity to overall market volatility. If the past is any guide, we would expect that artnet shares will rise quicker than the markets in times of optimism, but fall faster in times of pessimism. Many would argue that beta is useful in position sizing, but fundamental metrics such as revenue and earnings are more important overall. You can see artnet's revenue and earnings in the image below.
How does ART's size impact its beta?
artnet is a rather small company. It has a market capitalisation of €19m, which means it is probably under the radar of most investors. It takes less money to influence the share price of a very small company. This may explain the excess volatility implied by this beta value.
What this means for you:
Beta only tells us that the artnet share price is sensitive to broader market movements. This could indicate that it is a high growth company, or is heavily influenced by sentiment because it is speculative. Alternatively, it could have operating leverage in its business model. Ultimately, beta is an interesting metric, but there's plenty more to learn. This article aims to educate investors about beta values, but it's well worth looking at important company-specific fundamentals such as artnet’s financial health and performance track record. I urge you to continue your research by taking a look at the following:
Future Outlook: What are well-informed industry analysts predicting for ART’s future growth? Take a look at our free research report of analyst consensus for ART’s outlook.
Past Track Record: Has ART been consistently performing well irrespective of the ups and downs in the market? Go into more detail in the past performance analysis and take a look at the free visual representations of ART's historicals for more clarity.
Other Interesting Stocks: It's worth checking to see how ART measures up against other companies on valuation. You could start with this free list of prospective options.
We aim to bring you long-term focused research analysis driven by fundamental data. Note that our analysis may not factor in the latest price-sensitive company announcements or qualitative material.
If you spot an error that warrants correction, please contact the editor at editorial-team@simplywallst.com. This article by Simply Wall St is general in nature. It does not constitute a recommendation to buy or sell any stock, and does not take account of your objectives, or your financial situation. Simply Wall St has no position in the stocks mentioned. Thank you for reading.
