
 Yahoo Finance
 How Does Badger Daylighting Ltd. (TSE:BAD) Affect Your Portfolio Volatility?

Anyone researching Badger Daylighting Ltd. (TSE:BAD) might want to consider the historical volatility of the share price. Volatility is considered to be a measure of risk in modern finance theory. Investors may think of volatility as falling into two main categories. First, we have company specific volatility, which is the price gyrations of an individual stock. Holding at least 8 stocks can reduce this kind of risk across a portfolio. The second sort is caused by the natural volatility of markets, overall. For example, certain macroeconomic events will impact (virtually) all stocks on the market.
Some stocks see their prices move in concert with the market. Others tend towards stronger, gentler or unrelated price movements. Some investors use beta as a measure of how much a certain stock is impacted by market risk (volatility). While we should keep in mind that Warren Buffett has cautioned that 'Volatility is far from synonymous with risk', beta is still a useful factor to consider. To make good use of it you must first know that the beta of the overall market is one. Any stock with a beta of greater than one is considered more volatile than the market, while those with a beta below one are either less volatile or poorly correlated with the market.
See our latest analysis for Badger Daylighting
What we can learn from BAD's beta value
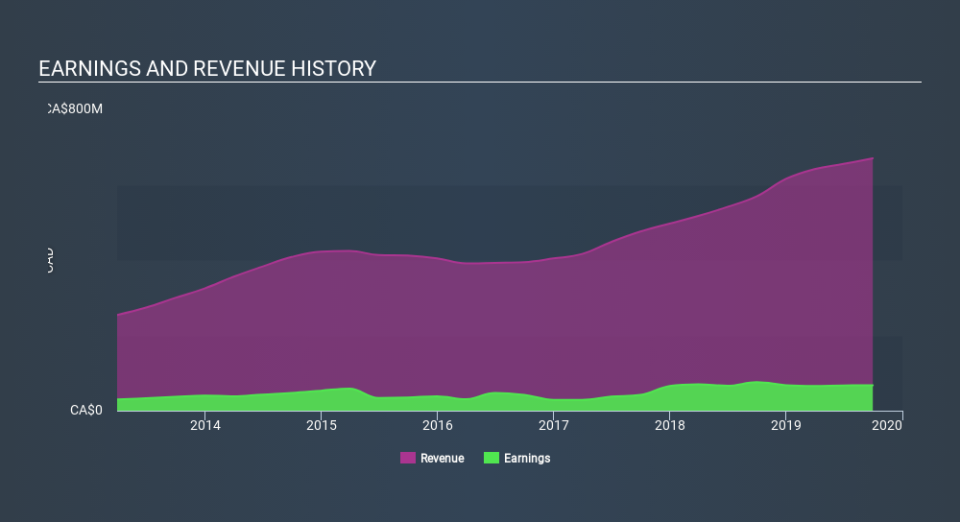
Looking at the last five years, Badger Daylighting has a beta of 1.10. The fact that this is well above 1 indicates that its share price movements have shown sensitivity to overall market volatility. If the past is any guide, we would expect that Badger Daylighting shares will rise quicker than the markets in times of optimism, but fall faster in times of pessimism. Share price volatility is well worth considering, but most long term investors consider the history of revenue and earnings growth to be more important. Take a look at how Badger Daylighting fares in that regard, below.
Could BAD's size cause it to be more volatile?
With a market capitalisation of CA$1.1b, Badger Daylighting is a small cap stock. However, it is big enough to catch the attention of professional investors. It's not particularly surprising that it has a higher beta than the overall market. That's because it takes less money to influence the share price of a smaller company, than a bigger company.
What this means for you:
Since Badger Daylighting has a reasonably high beta, it's worth considering why it is so heavily influenced by broader market sentiment. For example, it might be a high growth stock or have a lot of operating leverage in its business model. This article aims to educate investors about beta values, but it's well worth looking at important company-specific fundamentals such as Badger Daylighting’s financial health and performance track record. I highly recommend you dive deeper by considering the following:
Future Outlook: What are well-informed industry analysts predicting for BAD’s future growth? Take a look at our free research report of analyst consensus for BAD’s outlook.
Past Track Record: Has BAD been consistently performing well irrespective of the ups and downs in the market? Go into more detail in the past performance analysis and take a look at the free visual representations of BAD's historicals for more clarity.
Other Interesting Stocks: It's worth checking to see how BAD measures up against other companies on valuation. You could start with this free list of prospective options.
If you spot an error that warrants correction, please contact the editor at editorial-team@simplywallst.com. This article by Simply Wall St is general in nature. It does not constitute a recommendation to buy or sell any stock, and does not take account of your objectives, or your financial situation. Simply Wall St has no position in the stocks mentioned.
We aim to bring you long-term focused research analysis driven by fundamental data. Note that our analysis may not factor in the latest price-sensitive company announcements or qualitative material. Thank you for reading.
