
 Yahoo Finance
 How Does FirstEnergy's (NYSE:FE) P/E Compare To Its Industry, After Its Big Share Price Gain?

Those holding FirstEnergy (NYSE:FE) shares must be pleased that the share price has rebounded 33% in the last thirty days. But unfortunately, the stock is still down by 6.8% over a quarter. And the full year gain of 13% isn't too shabby, either!
All else being equal, a sharp share price increase should make a stock less attractive to potential investors. While the market sentiment towards a stock is very changeable, in the long run, the share price will tend to move in the same direction as earnings per share. So some would prefer to hold off buying when there is a lot of optimism towards a stock. Perhaps the simplest way to get a read on investors' expectations of a business is to look at its Price to Earnings Ratio (PE Ratio). A high P/E ratio means that investors have a high expectation about future growth, while a low P/E ratio means they have low expectations about future growth.
View our latest analysis for FirstEnergy
Does FirstEnergy Have A Relatively High Or Low P/E For Its Industry?
We can tell from its P/E ratio of 27.03 that there is some investor optimism about FirstEnergy. You can see in the image below that the average P/E (21.3) for companies in the electric utilities industry is lower than FirstEnergy's P/E.
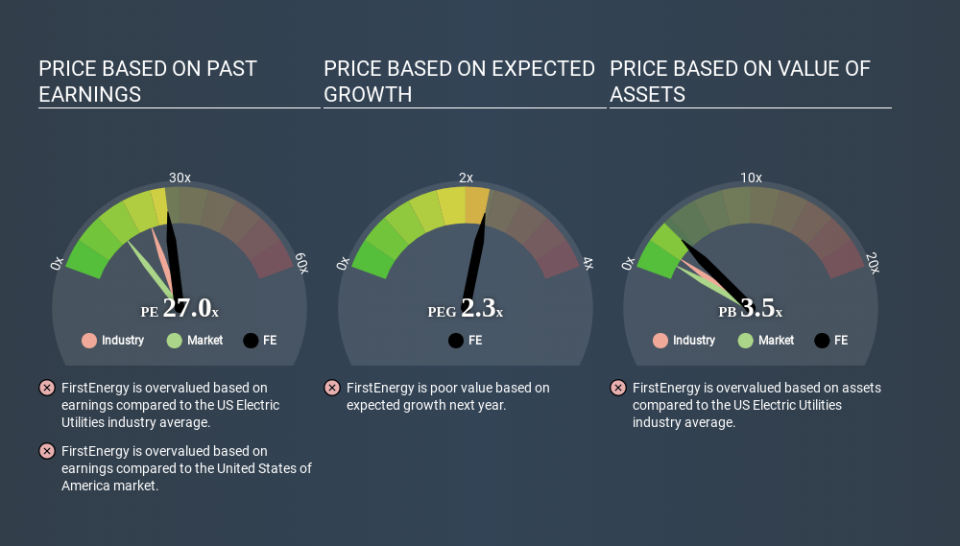
Its relatively high P/E ratio indicates that FirstEnergy shareholders think it will perform better than other companies in its industry classification. The market is optimistic about the future, but that doesn't guarantee future growth. So investors should always consider the P/E ratio alongside other factors, such as whether company directors have been buying shares.
How Growth Rates Impact P/E Ratios
Generally speaking the rate of earnings growth has a profound impact on a company's P/E multiple. Earnings growth means that in the future the 'E' will be higher. That means unless the share price increases, the P/E will reduce in a few years. A lower P/E should indicate the stock is cheap relative to others -- and that may attract buyers.
It's nice to see that FirstEnergy grew EPS by a stonking 26% in the last year. And it has bolstered its earnings per share by 27% per year over the last five years. So we'd generally expect it to have a relatively high P/E ratio.
A Limitation: P/E Ratios Ignore Debt and Cash In The Bank
Don't forget that the P/E ratio considers market capitalization. In other words, it does not consider any debt or cash that the company may have on the balance sheet. Hypothetically, a company could reduce its future P/E ratio by spending its cash (or taking on debt) to achieve higher earnings.
While growth expenditure doesn't always pay off, the point is that it is a good option to have; but one that the P/E ratio ignores.
So What Does FirstEnergy's Balance Sheet Tell Us?
FirstEnergy has net debt worth 82% of its market capitalization. This is enough debt that you'd have to make some adjustments before using the P/E ratio to compare it to a company with net cash.
The Verdict On FirstEnergy's P/E Ratio
FirstEnergy's P/E is 27.0 which is above average (13.7) in its market. It's good to see the recent earnings growth, although we note the company uses debt already. But if growth falters, the relatively high P/E ratio may prove to be unjustified. What is very clear is that the market has become significantly more optimistic about FirstEnergy over the last month, with the P/E ratio rising from 20.4 back then to 27.0 today. For those who prefer to invest with the flow of momentum, that might mean it's time to put the stock on a watchlist, or research it. But the contrarian may see it as a missed opportunity.
When the market is wrong about a stock, it gives savvy investors an opportunity. If the reality for a company is better than it expects, you can make money by buying and holding for the long term. So this free visual report on analyst forecasts could hold the key to an excellent investment decision.
You might be able to find a better buy than FirstEnergy. If you want a selection of possible winners, check out this free list of interesting companies that trade on a P/E below 20 (but have proven they can grow earnings).
If you spot an error that warrants correction, please contact the editor at editorial-team@simplywallst.com. This article by Simply Wall St is general in nature. It does not constitute a recommendation to buy or sell any stock, and does not take account of your objectives, or your financial situation. Simply Wall St has no position in the stocks mentioned.
We aim to bring you long-term focused research analysis driven by fundamental data. Note that our analysis may not factor in the latest price-sensitive company announcements or qualitative material. Thank you for reading.
