
 Yahoo Finance
 How Does Freehold Royalties's (TSE:FRU) P/E Compare To Its Industry, After The Share Price Drop?

To the annoyance of some shareholders, Freehold Royalties (TSE:FRU) shares are down a considerable 54% in the last month. Given the 60% drop over the last year, some shareholders might be worried that they have become bagholders. For those wondering, a bagholder is someone who keeps holding a losing stock indefinitely, without taking the time to consider its prospects carefully, going forward.
All else being equal, a share price drop should make a stock more attractive to potential investors. While the market sentiment towards a stock is very changeable, in the long run, the share price will tend to move in the same direction as earnings per share. The implication here is that long term investors have an opportunity when expectations of a company are too low. One way to gauge market expectations of a stock is to look at its Price to Earnings Ratio (PE Ratio). A high P/E implies that investors have high expectations of what a company can achieve compared to a company with a low P/E ratio.
View our latest analysis for Freehold Royalties
How Does Freehold Royalties's P/E Ratio Compare To Its Peers?
Freehold Royalties's P/E of 77.12 indicates some degree of optimism towards the stock. You can see in the image below that the average P/E (6.6) for companies in the oil and gas industry is a lot lower than Freehold Royalties's P/E.
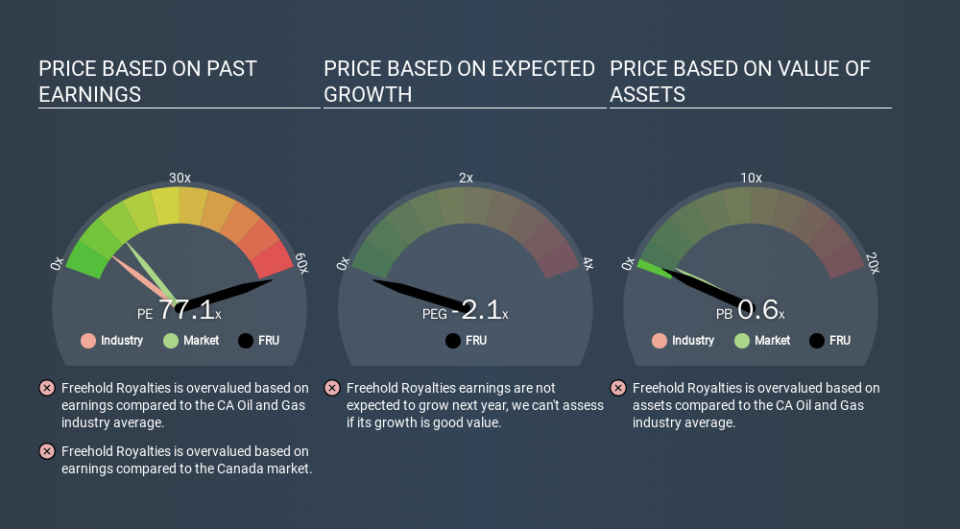
Freehold Royalties's P/E tells us that market participants think the company will perform better than its industry peers, going forward. Shareholders are clearly optimistic, but the future is always uncertain. So investors should always consider the P/E ratio alongside other factors, such as whether company directors have been buying shares.
How Growth Rates Impact P/E Ratios
Probably the most important factor in determining what P/E a company trades on is the earnings growth. If earnings are growing quickly, then the 'E' in the equation will increase faster than it would otherwise. That means even if the current P/E is high, it will reduce over time if the share price stays flat. So while a stock may look expensive based on past earnings, it could be cheap based on future earnings.
Freehold Royalties's earnings per share fell by 63% in the last twelve months. And it has shrunk its earnings per share by 46% per year over the last five years. This might lead to muted expectations.
A Limitation: P/E Ratios Ignore Debt and Cash In The Bank
The 'Price' in P/E reflects the market capitalization of the company. Thus, the metric does not reflect cash or debt held by the company. Hypothetically, a company could reduce its future P/E ratio by spending its cash (or taking on debt) to achieve higher earnings.
Spending on growth might be good or bad a few years later, but the point is that the P/E ratio does not account for the option (or lack thereof).
Is Debt Impacting Freehold Royalties's P/E?
Freehold Royalties has net debt equal to 27% of its market cap. While that's enough to warrant consideration, it doesn't really concern us.
The Verdict On Freehold Royalties's P/E Ratio
With a P/E ratio of 77.1, Freehold Royalties is expected to grow earnings very strongly in the years to come. With some debt but no EPS growth last year, the market has high expectations of future profits. What can be absolutely certain is that the market has become significantly less optimistic about Freehold Royalties over the last month, with the P/E ratio falling from 166.8 back then to 77.1 today. For those who don't like to trade against momentum, that could be a warning sign, but a contrarian investor might want to take a closer look.
Investors have an opportunity when market expectations about a stock are wrong. As value investor Benjamin Graham famously said, 'In the short run, the market is a voting machine but in the long run, it is a weighing machine. So this free visual report on analyst forecasts could hold the key to an excellent investment decision.
But note: Freehold Royalties may not be the best stock to buy. So take a peek at this free list of interesting companies with strong recent earnings growth (and a P/E ratio below 20).
If you spot an error that warrants correction, please contact the editor at editorial-team@simplywallst.com. This article by Simply Wall St is general in nature. It does not constitute a recommendation to buy or sell any stock, and does not take account of your objectives, or your financial situation. Simply Wall St has no position in the stocks mentioned.
We aim to bring you long-term focused research analysis driven by fundamental data. Note that our analysis may not factor in the latest price-sensitive company announcements or qualitative material. Thank you for reading.
