
 Yahoo Finance
 Does Fresenius SE & Co. KGaA (ETR:FRE) Have A Good P/E Ratio?

This article is for investors who would like to improve their understanding of price to earnings ratios (P/E ratios). We'll look at Fresenius SE & Co. KGaA's (ETR:FRE) P/E ratio and reflect on what it tells us about the company's share price. Looking at earnings over the last twelve months, Fresenius SE KGaA has a P/E ratio of 14.60. In other words, at today's prices, investors are paying €14.60 for every €1 in prior year profit.
Check out our latest analysis for Fresenius SE KGaA
How Do You Calculate Fresenius SE KGaA's P/E Ratio?
The formula for price to earnings is:
Price to Earnings Ratio = Share Price ÷ Earnings per Share (EPS)
Or for Fresenius SE KGaA:
P/E of 14.60 = €49.42 ÷ €3.39 (Based on the trailing twelve months to September 2019.)
Is A High P/E Ratio Good?
A higher P/E ratio implies that investors pay a higher price for the earning power of the business. That is not a good or a bad thing per se, but a high P/E does imply buyers are optimistic about the future.
Does Fresenius SE KGaA Have A Relatively High Or Low P/E For Its Industry?
The P/E ratio essentially measures market expectations of a company. The image below shows that Fresenius SE KGaA has a lower P/E than the average (31.1) P/E for companies in the healthcare industry.
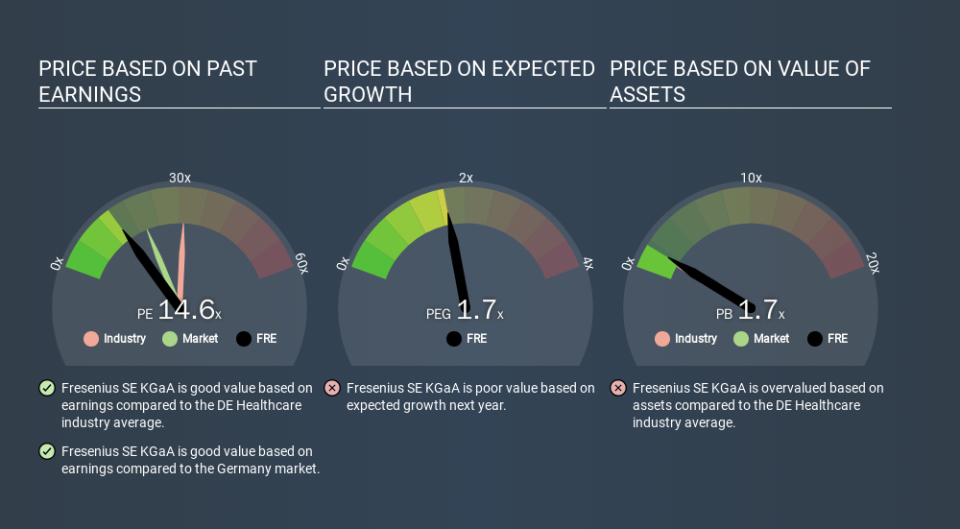
This suggests that market participants think Fresenius SE KGaA will underperform other companies in its industry. Since the market seems unimpressed with Fresenius SE KGaA, it's quite possible it could surprise on the upside. You should delve deeper. I like to check if company insiders have been buying or selling.
How Growth Rates Impact P/E Ratios
Earnings growth rates have a big influence on P/E ratios. Earnings growth means that in the future the 'E' will be higher. And in that case, the P/E ratio itself will drop rather quickly. A lower P/E should indicate the stock is cheap relative to others -- and that may attract buyers.
Fresenius SE KGaA shrunk earnings per share by 7.1% last year. But EPS is up 11% over the last 5 years.
Remember: P/E Ratios Don't Consider The Balance Sheet
One drawback of using a P/E ratio is that it considers market capitalization, but not the balance sheet. In other words, it does not consider any debt or cash that the company may have on the balance sheet. Hypothetically, a company could reduce its future P/E ratio by spending its cash (or taking on debt) to achieve higher earnings.
Such expenditure might be good or bad, in the long term, but the point here is that the balance sheet is not reflected by this ratio.
How Does Fresenius SE KGaA's Debt Impact Its P/E Ratio?
Fresenius SE KGaA has net debt worth 68% of its market capitalization. If you want to compare its P/E ratio to other companies, you should absolutely keep in mind it has significant borrowings.
The Bottom Line On Fresenius SE KGaA's P/E Ratio
Fresenius SE KGaA trades on a P/E ratio of 14.6, which is below the DE market average of 20.4. When you consider that the company has significant debt, and didn't grow EPS last year, it isn't surprising that the market has muted expectations.
Investors have an opportunity when market expectations about a stock are wrong. If it is underestimating a company, investors can make money by buying and holding the shares until the market corrects itself. So this free report on the analyst consensus forecasts could help you make a master move on this stock.
Of course you might be able to find a better stock than Fresenius SE KGaA. So you may wish to see this free collection of other companies that have grown earnings strongly.
If you spot an error that warrants correction, please contact the editor at editorial-team@simplywallst.com. This article by Simply Wall St is general in nature. It does not constitute a recommendation to buy or sell any stock, and does not take account of your objectives, or your financial situation. Simply Wall St has no position in the stocks mentioned.
We aim to bring you long-term focused research analysis driven by fundamental data. Note that our analysis may not factor in the latest price-sensitive company announcements or qualitative material. Thank you for reading.
