
 Yahoo Finance
 Does Greene King plc’s (LON:GNK) Debt Level Pose A Problem?

Stocks with market capitalization between $2B and $10B, such as Greene King plc (LON:GNK) with a size of UK£1.7b, do not attract as much attention from the investing community as do the small-caps and large-caps. Despite this, commonly overlooked mid-caps have historically produced better risk-adjusted returns than their small and large-cap counterparts. GNK’s financial liquidity and debt position will be analysed in this article, to get an idea of whether the company can fund opportunities for strategic growth and maintain strength through economic downturns. Note that this information is centred entirely on financial health and is a top-level understanding, so I encourage you to look further into GNK here.
View our latest analysis for Greene King
Does GNK produce enough cash relative to debt?
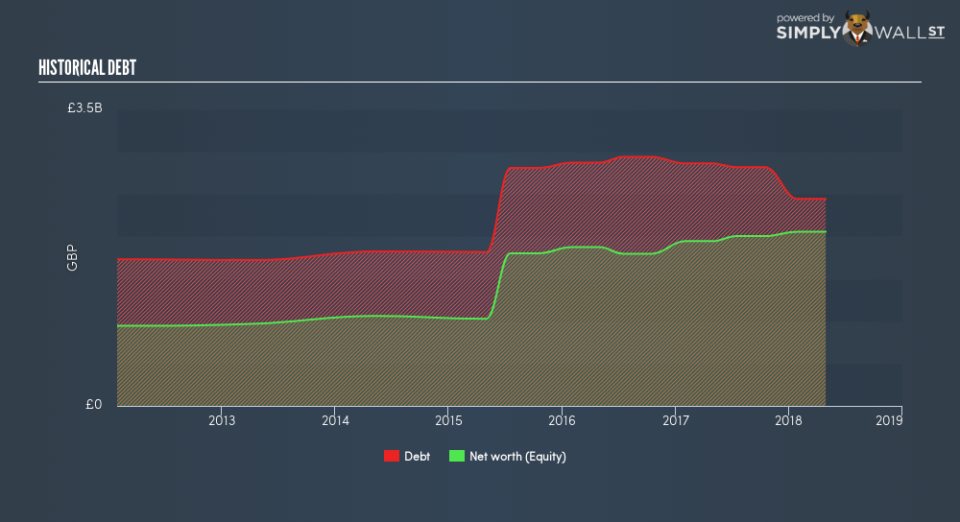
Over the past year, GNK has reduced its debt from UK£2.9b to UK£2.4b , which includes long-term debt. With this debt repayment, GNK currently has UK£169m remaining in cash and short-term investments for investing into the business. Moreover, GNK has generated cash from operations of UK£266m in the last twelve months, resulting in an operating cash to total debt ratio of 11%, indicating that GNK’s debt is not appropriately covered by operating cash. This ratio can also be interpreted as a measure of efficiency as an alternative to return on assets. In GNK’s case, it is able to generate 0.11x cash from its debt capital.
Does GNK’s liquid assets cover its short-term commitments?
With current liabilities at UK£543m, it seems that the business may not have an easy time meeting these commitments with a current assets level of UK£359m, leading to a current ratio of 0.66x.
Does GNK face the risk of succumbing to its debt-load?
With total debt exceeding equities, GNK is considered a highly levered company. This is not unusual for mid-caps as debt tends to be a cheaper and faster source of funding for some businesses. We can check to see whether GNK is able to meet its debt obligations by looking at the net interest coverage ratio. A company generating earnings before interest and tax (EBIT) at least three times its net interest payments is considered financially sound. In GNK’s, case, the ratio of 3.19x suggests that interest is appropriately covered, which means that lenders may be less hesitant to lend out more funding as GNK’s high interest coverage is seen as responsible and safe practice.
Next Steps:
Although GNK’s debt level is towards the higher end of the spectrum, its cash flow coverage seems adequate to meet debt obligations which means its debt is being efficiently utilised. However, its low liquidity raises concerns over whether current asset management practices are properly implemented for the mid-cap. Keep in mind I haven’t considered other factors such as how GNK has been performing in the past. I recommend you continue to research Greene King to get a more holistic view of the stock by looking at:
Future Outlook: What are well-informed industry analysts predicting for GNK’s future growth? Take a look at our free research report of analyst consensus for GNK’s outlook.
Valuation: What is GNK worth today? Is the stock undervalued, even when its growth outlook is factored into its intrinsic value? The intrinsic value infographic in our free research report helps visualize whether GNK is currently mispriced by the market.
Other High-Performing Stocks: Are there other stocks that provide better prospects with proven track records? Explore our free list of these great stocks here.
To help readers see past the short term volatility of the financial market, we aim to bring you a long-term focused research analysis purely driven by fundamental data. Note that our analysis does not factor in the latest price-sensitive company announcements.
The author is an independent contributor and at the time of publication had no position in the stocks mentioned. For errors that warrant correction please contact the editor at editorial-team@simplywallst.com.
