
 Yahoo Finance
 Does Pantheon Resources Plc’s (LON:PANR) Past Performance Indicate A Weaker Future?

Examining Pantheon Resources Plc’s (AIM:PANR) past track record of performance is a useful exercise for investors. It allows us to reflect on whether the company has met or exceed expectations, which is a powerful signal for future performance. Below, I will assess PANR’s latest performance announced on 31 December 2017 and weight these figures against its longer term trend and industry movements. See our latest analysis for Pantheon Resources
How Well Did PANR Perform?
I use data from the most recent 12 months, which either annualizes the most recent 6-month earnings update, or in some cases, the most recent annual report is already the latest available financial data. This allows me to examine various companies on a more comparable basis, using new information. For Pantheon Resources, its latest earnings (trailing twelve month) is -US$3.43M, which, relative to the previous year’s figure, has become more negative. Since these values are relatively short-term thinking, I’ve determined an annualized five-year figure for Pantheon Resources’s net income, which stands at -US$1.48M. This doesn’t look much better, since earnings seem to have gradually been getting more and more negative over time.
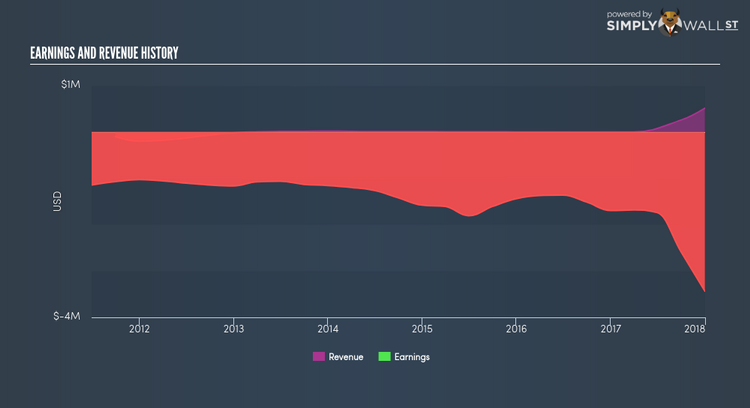
We can further assess Pantheon Resources’s loss by looking at what the industry has been experiencing over the past few years. Each year, for the past half a decade Pantheon Resources’s top-line has increased by 86.41% on average, signalling that the company is in a high-growth phase with expenses racing ahead revenues, leading to annual losses. Inspecting growth from a sector-level, the UK oil and gas industry has been growing its average earnings by double-digit 33.12% over the past year, and a less exciting 3.87% over the last five years. This means whatever uplift the industry is profiting from, Pantheon Resources has not been able to gain as much as its average peer.
What does this mean?
Though Pantheon Resources’s past data is helpful, it is only one aspect of my investment thesis. With companies that are currently loss-making, it is always difficult to envisage what will happen in the future and when. The most insightful step is to assess company-specific issues Pantheon Resources may be facing and whether management guidance has steadily been met in the past. You should continue to research Pantheon Resources to get a better picture of the stock by looking at:
Financial Health: Is PANR’s operations financially sustainable? Balance sheets can be hard to analyze, which is why we’ve done it for you. Check out our financial health checks here.
Other High-Performing Stocks: Are there other stocks that provide better prospects with proven track records? Explore our free list of these great stocks here.
NB: Figures in this article are calculated using data from the trailing twelve months from 31 December 2017. This may not be consistent with full year annual report figures.
To help readers see pass the short term volatility of the financial market, we aim to bring you a long-term focused research analysis purely driven by fundamental data. Note that our analysis does not factor in the latest price sensitive company announcements.
The author is an independent contributor and at the time of publication had no position in the stocks mentioned.
