
 Yahoo Finance
 Does Pennon Group Plc's (LON:PNN) CEO Salary Compare Well With Others?

In 2016 Chris Loughlin was appointed CEO of Pennon Group Plc (LON:PNN). This report will, first, examine the CEO compensation levels in comparison to CEO compensation at companies of similar size. After that, we will consider the growth in the business. And finally - as a second measure of performance - we will look at the returns shareholders have received over the last few years. This method should give us information to assess how appropriately the company pays the CEO.
See our latest analysis for Pennon Group
How Does Chris Loughlin's Compensation Compare With Similar Sized Companies?
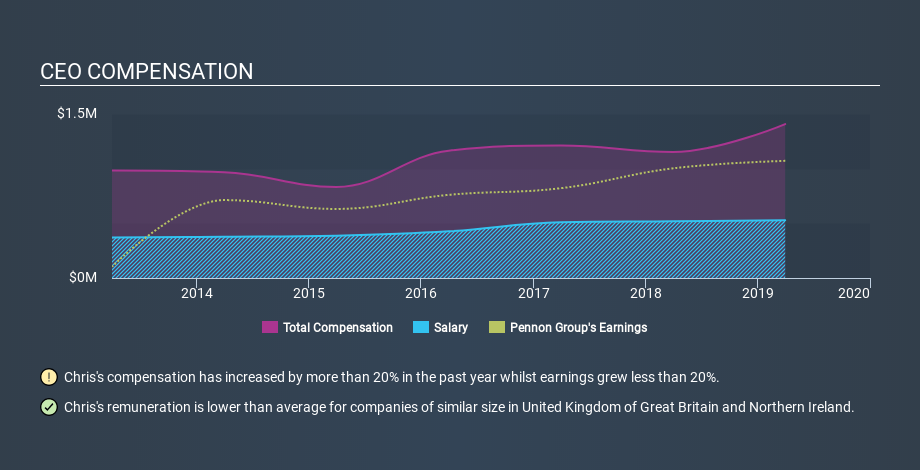
According to our data, Pennon Group Plc has a market capitalization of UK£4.2b, and paid its CEO total annual compensation worth UK£1.4m over the year to March 2019. We think total compensation is more important but we note that the CEO salary is lower, at UK£528k. We further remind readers that the CEO may face performance requirements to receive the non-salary part of the total compensation. As part of our analysis we looked at companies in the same jurisdiction, with market capitalizations of UK£3.1b to UK£9.2b. The median total CEO compensation was UK£2.6m.
This would give shareholders a good impression of the company, since most similar size companies have to pay more, leaving less for shareholders. While this is a good thing, you'll need to understand the business better before you can form an opinion.
You can see, below, how CEO compensation at Pennon Group has changed over time.
Is Pennon Group Plc Growing?
Pennon Group Plc has increased its earnings per share (EPS) by an average of 13% a year, over the last three years (using a line of best fit). Its revenue is up 2.0% over last year.
This demonstrates that the company has been improving recently. A good result. It's nice to see a little revenue growth, as this is consistent with healthy business conditions. It could be important to check this free visual depiction of what analysts expect for the future.
Has Pennon Group Plc Been A Good Investment?
Boasting a total shareholder return of 45% over three years, Pennon Group Plc has done well by shareholders. As a result, some may believe the CEO should be paid more than is normal for companies of similar size.
In Summary...
It looks like Pennon Group Plc pays its CEO less than similar sized companies.
Since the business is growing, many would argue this suggests the pay is modest. The strong history of shareholder returns might even have some thinking that Chris Loughlin deserves a raise! It is relatively rare to see a modestly paid CEO when performance is so impressive. The cherry on top would be if company insiders are buying shares with their own money. So you may want to check if insiders are buying Pennon Group shares with their own money (free access).
Arguably, business quality is much more important than CEO compensation levels. So check out this free list of interesting companies, that have HIGH return on equity and low debt.
If you spot an error that warrants correction, please contact the editor at editorial-team@simplywallst.com. This article by Simply Wall St is general in nature. It does not constitute a recommendation to buy or sell any stock, and does not take account of your objectives, or your financial situation. Simply Wall St has no position in the stocks mentioned.
We aim to bring you long-term focused research analysis driven by fundamental data. Note that our analysis may not factor in the latest price-sensitive company announcements or qualitative material. Thank you for reading.
