
 Yahoo Finance
 What Does Rotork plc's (LON:ROR) P/E Ratio Tell You?
The goal of this article is to teach you how to use price to earnings ratios (P/E ratios). To keep it practical, we'll show how Rotork plc's (LON:ROR) P/E ratio could help you assess the value on offer. Rotork has a P/E ratio of 29.72, based on the last twelve months. That means that at current prices, buyers pay £29.72 for every £1 in trailing yearly profits.
See our latest analysis for Rotork
How Do I Calculate A Price To Earnings Ratio?
The formula for P/E is:
Price to Earnings Ratio = Price per Share ÷ Earnings per Share (EPS)
Or for Rotork:
P/E of 29.72 = £3.09 ÷ £0.10 (Based on the trailing twelve months to June 2019.)
Is A High Price-to-Earnings Ratio Good?
The higher the P/E ratio, the higher the price tag of a business, relative to its trailing earnings. That is not a good or a bad thing per se, but a high P/E does imply buyers are optimistic about the future.
How Does Rotork's P/E Ratio Compare To Its Peers?
The P/E ratio essentially measures market expectations of a company. You can see in the image below that the average P/E (20.6) for companies in the machinery industry is lower than Rotork's P/E.
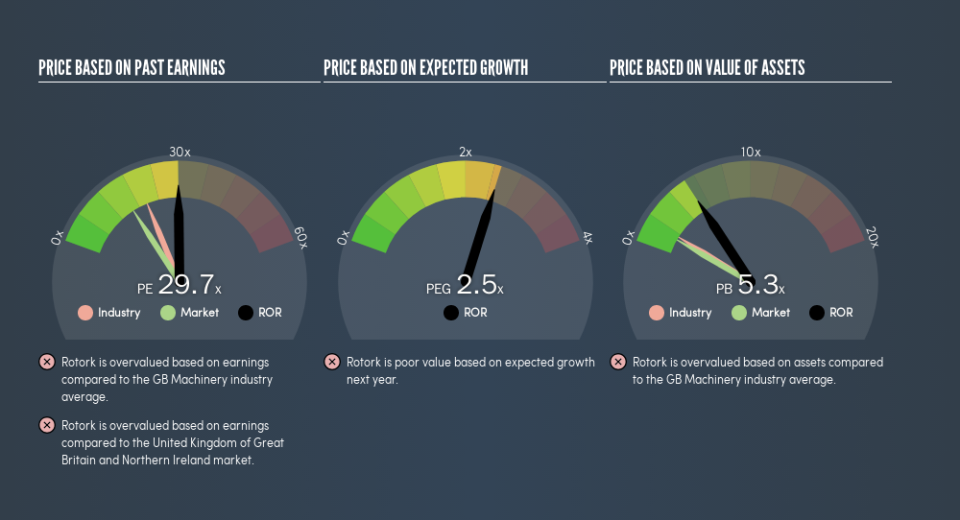
Its relatively high P/E ratio indicates that Rotork shareholders think it will perform better than other companies in its industry classification. Clearly the market expects growth, but it isn't guaranteed. So investors should delve deeper. I like to check if company insiders have been buying or selling.
How Growth Rates Impact P/E Ratios
Earnings growth rates have a big influence on P/E ratios. If earnings are growing quickly, then the 'E' in the equation will increase faster than it would otherwise. Therefore, even if you pay a high multiple of earnings now, that multiple will become lower in the future. And as that P/E ratio drops, the company will look cheap, unless its share price increases.
Rotork's 52% EPS improvement over the last year was like bamboo growth after rain; rapid and impressive. Having said that, the average EPS growth over the last three years wasn't so good, coming in at 14%. Regrettably, the longer term performance is poor, with EPS down 1.7% per year over 5 years.
A Limitation: P/E Ratios Ignore Debt and Cash In The Bank
Don't forget that the P/E ratio considers market capitalization. In other words, it does not consider any debt or cash that the company may have on the balance sheet. In theory, a company can lower its future P/E ratio by using cash or debt to invest in growth.
Such spending might be good or bad, overall, but the key point here is that you need to look at debt to understand the P/E ratio in context.
How Does Rotork's Debt Impact Its P/E Ratio?
Rotork has net cash of UK£55m. That should lead to a higher P/E than if it did have debt, because its strong balance sheets gives it more options.
The Verdict On Rotork's P/E Ratio
Rotork's P/E is 29.7 which is above average (16) in its market. The excess cash it carries is the gravy on top its fast EPS growth. So based on this analysis we'd expect Rotork to have a high P/E ratio.
When the market is wrong about a stock, it gives savvy investors an opportunity. If the reality for a company is better than it expects, you can make money by buying and holding for the long term. So this free visualization of the analyst consensus on future earnings could help you make the right decision about whether to buy, sell, or hold.
Of course you might be able to find a better stock than Rotork. So you may wish to see this free collection of other companies that have grown earnings strongly.
We aim to bring you long-term focused research analysis driven by fundamental data. Note that our analysis may not factor in the latest price-sensitive company announcements or qualitative material.
If you spot an error that warrants correction, please contact the editor at editorial-team@simplywallst.com. This article by Simply Wall St is general in nature. It does not constitute a recommendation to buy or sell any stock, and does not take account of your objectives, or your financial situation. Simply Wall St has no position in the stocks mentioned. Thank you for reading.
