
 Yahoo Finance
 How Does The Weir Group PLC (LON:WEIR) Fare As A Dividend Stock?

Is The Weir Group PLC (LON:WEIR) a good dividend stock? How can we tell? Dividend paying companies with growing earnings can be highly rewarding in the long term. On the other hand, investors have been known to buy a stock because of its yield, and then lose money if the company's dividend doesn't live up to expectations.
A high yield and a long history of paying dividends is an appealing combination for Weir Group. It would not be a surprise to discover that many investors buy it for the dividends. There are a few simple ways to reduce the risks of buying Weir Group for its dividend, and we'll go through these below.
Explore this interactive chart for our latest analysis on Weir Group!
Payout ratios
Dividends are typically paid from company earnings. If a company pays more in dividends than it earned, then the dividend might become unsustainable - hardly an ideal situation. Comparing dividend payments to a company's net profit after tax is a simple way of reality-checking whether a dividend is sustainable. Looking at the data, we can see that 183% of Weir Group's profits were paid out as dividends in the last 12 months. A payout ratio above 100% is definitely an item of concern, unless there are some other circumstances that would justify it.
We also measure dividends paid against a company's levered free cash flow, to see if enough cash was generated to cover the dividend. Last year, Weir Group paid a dividend while reporting negative free cash flow. While there may be an explanation, we think this behaviour is generally not sustainable.
Is Weir Group's Balance Sheet Risky?
As Weir Group's dividend was not well covered by earnings, we need to check its balance sheet for signs of financial distress. A quick check of its financial situation can be done with two ratios: net debt divided by EBITDA (earnings before interest, tax, depreciation and amortisation), and net interest cover. Net debt to EBITDA measures total debt load relative to company earnings (lower = less debt), while net interest cover measures the ability to pay interest on the debt (higher = greater ability to pay interest costs). Weir Group has net debt of 2.96 times its EBITDA. Using debt can accelerate business growth, but also increases the risks.
Net interest cover can be calculated by dividing earnings before interest and tax (EBIT) by the company's net interest expense. Net interest cover of 7.00 times its interest expense appears reasonable for Weir Group, although we're conscious that even high interest cover doesn't make a company bulletproof.
Consider getting our latest analysis on Weir Group's financial position here.
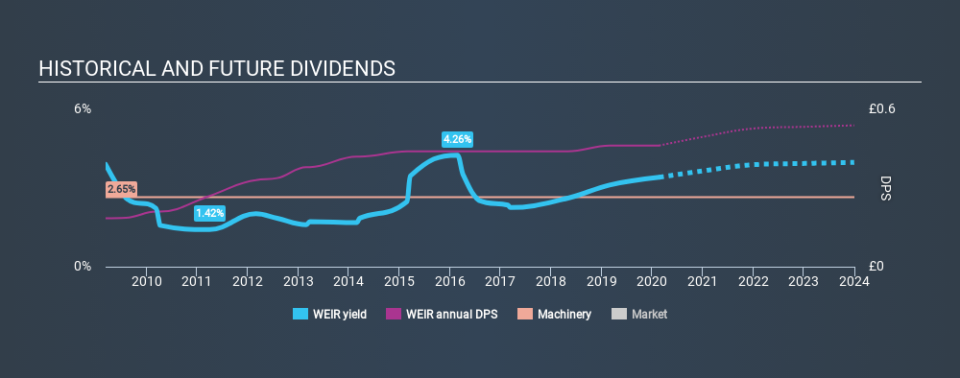
Dividend Volatility
One of the major risks of relying on dividend income, is the potential for a company to struggle financially and cut its dividend. Not only is your income cut, but the value of your investment declines as well - nasty. For the purpose of this article, we only scrutinise the last decade of Weir Group's dividend payments. The dividend has been stable over the past 10 years, which is great. We think this could suggest some resilience to the business and its dividends. During the past ten-year period, the first annual payment was UK£0.18 in 2010, compared to UK£0.46 last year. This works out to be a compound annual growth rate (CAGR) of approximately 9.6% a year over that time.
Dividends have grown at a reasonable rate over this period, and without any major cuts in the payment over time, we think this is an attractive combination.
Dividend Growth Potential
While dividend payments have been relatively reliable, it would also be nice if earnings per share (EPS) were growing, as this is essential to maintaining the dividend's purchasing power over the long term. Weir Group's EPS have fallen by approximately 30% per year during the past five years. A sharp decline in earnings per share is not great from from a dividend perspective, as even conservative payout ratios can come under pressure if earnings fall far enough.
Conclusion
Dividend investors should always want to know if a) a company's dividends are affordable, b) if there is a track record of consistent payments, and c) if the dividend is capable of growing. Weir Group paid out almost all of its cash flow and profit as dividends, leaving little to reinvest in the business. It's not great to see earnings per share shrinking. The dividends have been relatively consistent, but we wonder for how much longer this will be true. In this analysis, Weir Group doesn't shape up too well as a dividend stock. We'd find it hard to look past the flaws, and would not be inclined to think of it as a reliable dividend-payer.
Without at least some growth in earnings per share over time, the dividend will eventually come under pressure either from costs or inflation. Very few businesses see earnings consistently shrink year after year in perpetuity though, and so it might be worth seeing what the 20 analysts we track are forecasting for the future.
Looking for more high-yielding dividend ideas? Try our curated list of dividend stocks with a yield above 3%.
If you spot an error that warrants correction, please contact the editor at editorial-team@simplywallst.com. This article by Simply Wall St is general in nature. It does not constitute a recommendation to buy or sell any stock, and does not take account of your objectives, or your financial situation. Simply Wall St has no position in the stocks mentioned.
We aim to bring you long-term focused research analysis driven by fundamental data. Note that our analysis may not factor in the latest price-sensitive company announcements or qualitative material. Thank you for reading.
