
 Yahoo Finance
 Don't Sell Brewin Dolphin Holdings PLC (LON:BRW) Before You Read This

This article is for investors who would like to improve their understanding of price to earnings ratios (P/E ratios). We'll apply a basic P/E ratio analysis to Brewin Dolphin Holdings PLC's (LON:BRW), to help you decide if the stock is worth further research. Brewin Dolphin Holdings has a P/E ratio of 17.26, based on the last twelve months. In other words, at today's prices, investors are paying £17.26 for every £1 in prior year profit.
View our latest analysis for Brewin Dolphin Holdings
How Do You Calculate A P/E Ratio?
The formula for price to earnings is:
Price to Earnings Ratio = Price per Share ÷ Earnings per Share (EPS)
Or for Brewin Dolphin Holdings:
P/E of 17.26 = £3.12 ÷ £0.18 (Based on the trailing twelve months to March 2019.)
Is A High Price-to-Earnings Ratio Good?
A higher P/E ratio implies that investors pay a higher price for the earning power of the business. That isn't a good or a bad thing on its own, but a high P/E means that buyers have a higher opinion of the business's prospects, relative to stocks with a lower P/E.
Does Brewin Dolphin Holdings Have A Relatively High Or Low P/E For Its Industry?
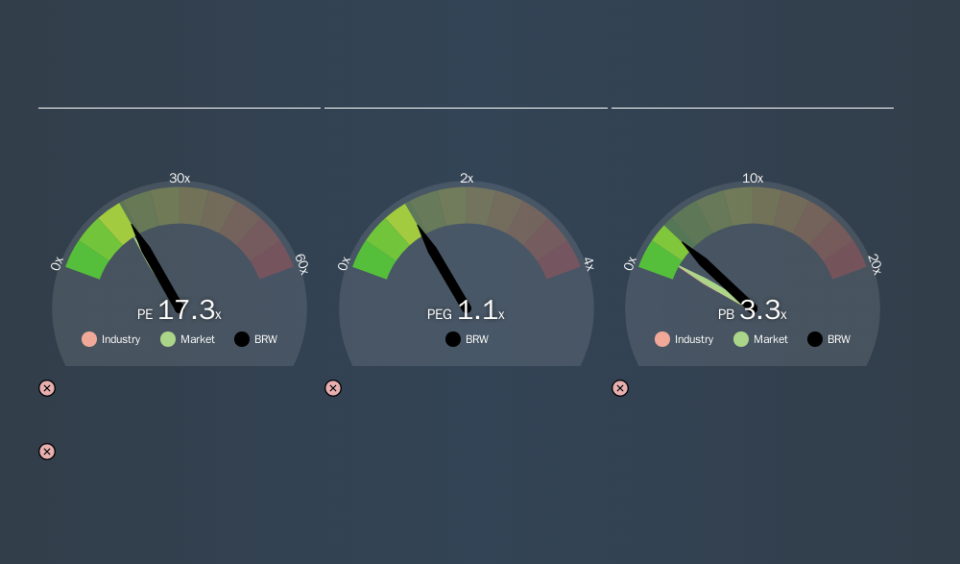
One good way to get a quick read on what market participants expect of a company is to look at its P/E ratio. The image below shows that Brewin Dolphin Holdings has a P/E ratio that is roughly in line with the capital markets industry average (17).
Brewin Dolphin Holdings's P/E tells us that market participants think its prospects are roughly in line with its industry. So if Brewin Dolphin Holdings actually outperforms its peers going forward, that should be a positive for the share price. Further research into factors such as insider buying and selling, could help you form your own view on whether that is likely.
How Growth Rates Impact P/E Ratios
Probably the most important factor in determining what P/E a company trades on is the earnings growth. That's because companies that grow earnings per share quickly will rapidly increase the 'E' in the equation. That means even if the current P/E is high, it will reduce over time if the share price stays flat. So while a stock may look expensive based on past earnings, it could be cheap based on future earnings.
Brewin Dolphin Holdings had pretty flat EPS growth in the last year. But it has grown its earnings per share by 6.8% per year over the last five years.
Remember: P/E Ratios Don't Consider The Balance Sheet
One drawback of using a P/E ratio is that it considers market capitalization, but not the balance sheet. In other words, it does not consider any debt or cash that the company may have on the balance sheet. Theoretically, a business can improve its earnings (and produce a lower P/E in the future) by investing in growth. That means taking on debt (or spending its cash).
Such expenditure might be good or bad, in the long term, but the point here is that the balance sheet is not reflected by this ratio.
Brewin Dolphin Holdings's Balance Sheet
Brewin Dolphin Holdings has net cash of UK£140m. This is fairly high at 15% of its market capitalization. That might mean balance sheet strength is important to the business, but should also help push the P/E a bit higher than it would otherwise be.
The Bottom Line On Brewin Dolphin Holdings's P/E Ratio
Brewin Dolphin Holdings trades on a P/E ratio of 17.3, which is above its market average of 16. Earnings improved over the last year. Also positive, the relatively strong balance sheet will allow for investment in growth -- and the P/E indicates shareholders that will happen!
Investors should be looking to buy stocks that the market is wrong about. If the reality for a company is better than it expects, you can make money by buying and holding for the long term. So this free visual report on analyst forecasts could hold the key to an excellent investment decision.
Of course, you might find a fantastic investment by looking at a few good candidates. So take a peek at this free list of companies with modest (or no) debt, trading on a P/E below 20.
We aim to bring you long-term focused research analysis driven by fundamental data. Note that our analysis may not factor in the latest price-sensitive company announcements or qualitative material.
If you spot an error that warrants correction, please contact the editor at editorial-team@simplywallst.com. This article by Simply Wall St is general in nature. It does not constitute a recommendation to buy or sell any stock, and does not take account of your objectives, or your financial situation. Simply Wall St has no position in the stocks mentioned. Thank you for reading.
