
 Yahoo Finance
 DT Midstream (NYSE:DTM) Is Reinvesting At Lower Rates Of Return
To find a multi-bagger stock, what are the underlying trends we should look for in a business? In a perfect world, we'd like to see a company investing more capital into its business and ideally the returns earned from that capital are also increasing. Put simply, these types of businesses are compounding machines, meaning they are continually reinvesting their earnings at ever-higher rates of return. Having said that, from a first glance at DT Midstream (NYSE:DTM) we aren't jumping out of our chairs at how returns are trending, but let's have a deeper look.
Understanding Return On Capital Employed (ROCE)
For those that aren't sure what ROCE is, it measures the amount of pre-tax profits a company can generate from the capital employed in its business. The formula for this calculation on DT Midstream is:
Return on Capital Employed = Earnings Before Interest and Tax (EBIT) ÷ (Total Assets - Current Liabilities)
0.056 = US$481m ÷ (US$9.0b - US$322m) (Based on the trailing twelve months to March 2024).
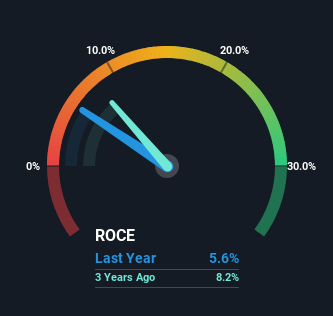
Therefore, DT Midstream has an ROCE of 5.6%. Ultimately, that's a low return and it under-performs the Oil and Gas industry average of 12%.
See our latest analysis for DT Midstream
In the above chart we have measured DT Midstream's prior ROCE against its prior performance, but the future is arguably more important. If you're interested, you can view the analysts predictions in our free analyst report for DT Midstream .
How Are Returns Trending?
On the surface, the trend of ROCE at DT Midstream doesn't inspire confidence. Around five years ago the returns on capital were 8.0%, but since then they've fallen to 5.6%. However it looks like DT Midstream might be reinvesting for long term growth because while capital employed has increased, the company's sales haven't changed much in the last 12 months. It may take some time before the company starts to see any change in earnings from these investments.
On a related note, DT Midstream has decreased its current liabilities to 3.6% of total assets. So we could link some of this to the decrease in ROCE. Effectively this means their suppliers or short-term creditors are funding less of the business, which reduces some elements of risk. Since the business is basically funding more of its operations with it's own money, you could argue this has made the business less efficient at generating ROCE.
What We Can Learn From DT Midstream's ROCE
In summary, DT Midstream is reinvesting funds back into the business for growth but unfortunately it looks like sales haven't increased much just yet. Since the stock has gained an impressive 89% over the last three years, investors must think there's better things to come. But if the trajectory of these underlying trends continue, we think the likelihood of it being a multi-bagger from here isn't high.
DT Midstream does have some risks though, and we've spotted 2 warning signs for DT Midstream that you might be interested in.
For those who like to invest in solid companies, check out this free list of companies with solid balance sheets and high returns on equity.
Have feedback on this article? Concerned about the content? Get in touch with us directly. Alternatively, email editorial-team (at) simplywallst.com.
This article by Simply Wall St is general in nature. We provide commentary based on historical data and analyst forecasts only using an unbiased methodology and our articles are not intended to be financial advice. It does not constitute a recommendation to buy or sell any stock, and does not take account of your objectives, or your financial situation. We aim to bring you long-term focused analysis driven by fundamental data. Note that our analysis may not factor in the latest price-sensitive company announcements or qualitative material. Simply Wall St has no position in any stocks mentioned.
Have feedback on this article? Concerned about the content? Get in touch with us directly. Alternatively, email editorial-team@simplywallst.com
