
 Yahoo Finance
 Dyna-Mac Holdings (SGX:NO4) Is Doing The Right Things To Multiply Its Share Price
If we want to find a potential multi-bagger, often there are underlying trends that can provide clues. One common approach is to try and find a company with returns on capital employed (ROCE) that are increasing, in conjunction with a growing amount of capital employed. Basically this means that a company has profitable initiatives that it can continue to reinvest in, which is a trait of a compounding machine. Speaking of which, we noticed some great changes in Dyna-Mac Holdings' (SGX:NO4) returns on capital, so let's have a look.
Understanding Return On Capital Employed (ROCE)
For those that aren't sure what ROCE is, it measures the amount of pre-tax profits a company can generate from the capital employed in its business. Analysts use this formula to calculate it for Dyna-Mac Holdings:
Return on Capital Employed = Earnings Before Interest and Tax (EBIT) ÷ (Total Assets - Current Liabilities)
0.16 = S$18m ÷ (S$345m - S$229m) (Based on the trailing twelve months to December 2023).
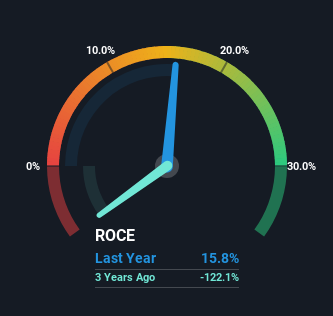
So, Dyna-Mac Holdings has an ROCE of 16%. In absolute terms, that's a satisfactory return, but compared to the Energy Services industry average of 11% it's much better.
View our latest analysis for Dyna-Mac Holdings
Above you can see how the current ROCE for Dyna-Mac Holdings compares to its prior returns on capital, but there's only so much you can tell from the past. If you're interested, you can view the analysts predictions in our free analyst report for Dyna-Mac Holdings .
What The Trend Of ROCE Can Tell Us
Dyna-Mac Holdings has broken into the black (profitability) and we're sure it's a sight for sore eyes. The company now earns 16% on its capital, because five years ago it was incurring losses. Interestingly, the capital employed by the business has remained relatively flat, so these higher returns are either from prior investments paying off or increased efficiencies. So while we're happy that the business is more efficient, just keep in mind that could mean that going forward the business is lacking areas to invest internally for growth. So if you're looking for high growth, you'll want to see a business's capital employed also increasing.
For the record though, there was a noticeable increase in the company's current liabilities over the period, so we would attribute some of the ROCE growth to that. Essentially the business now has suppliers or short-term creditors funding about 66% of its operations, which isn't ideal. Given it's pretty high ratio, we'd remind investors that having current liabilities at those levels can bring about some risks in certain businesses.
Our Take On Dyna-Mac Holdings' ROCE
To sum it up, Dyna-Mac Holdings is collecting higher returns from the same amount of capital, and that's impressive. Since the stock has returned a staggering 269% to shareholders over the last five years, it looks like investors are recognizing these changes. So given the stock has proven it has promising trends, it's worth researching the company further to see if these trends are likely to persist.
While Dyna-Mac Holdings looks impressive, no company is worth an infinite price. The intrinsic value infographic for NO4 helps visualize whether it is currently trading for a fair price.
If you want to search for solid companies with great earnings, check out this free list of companies with good balance sheets and impressive returns on equity.
Have feedback on this article? Concerned about the content? Get in touch with us directly. Alternatively, email editorial-team (at) simplywallst.com.
This article by Simply Wall St is general in nature. We provide commentary based on historical data and analyst forecasts only using an unbiased methodology and our articles are not intended to be financial advice. It does not constitute a recommendation to buy or sell any stock, and does not take account of your objectives, or your financial situation. We aim to bring you long-term focused analysis driven by fundamental data. Note that our analysis may not factor in the latest price-sensitive company announcements or qualitative material. Simply Wall St has no position in any stocks mentioned.
Have feedback on this article? Concerned about the content? Get in touch with us directly. Alternatively, email editorial-team@simplywallst.com
