
 Yahoo Finance
 E-mini Dow Jones Industrial Average (YM) Futures Technical Analysis – Testing Support Zone at 25053 to 24484
September E-mini Dow Jones Industrial Average futures are trading nearly flat early Monday as a continued rise in cases of the novel coronavirus at home and around the world deepened fears of further economic pain. Investors were cautious as global cases crossed 10 million.
Traders seem to be in a holding pattern after Wall Street faltered on Friday as some U.S. States reconsidered their reopening plans. The global death toll from COVID-19 reached half a million people on Sunday, according to a Reuters tally.
At 03:22 GMT, September E-mini Dow Jones Industrial Average futures are at 24947, down 3 or -0.01%.
About one-quarter of all the deaths so far have been in the United States, with cases surging in a handful of southern and western states that reopened earlier.
Daily Swing Chart Technical Analysis
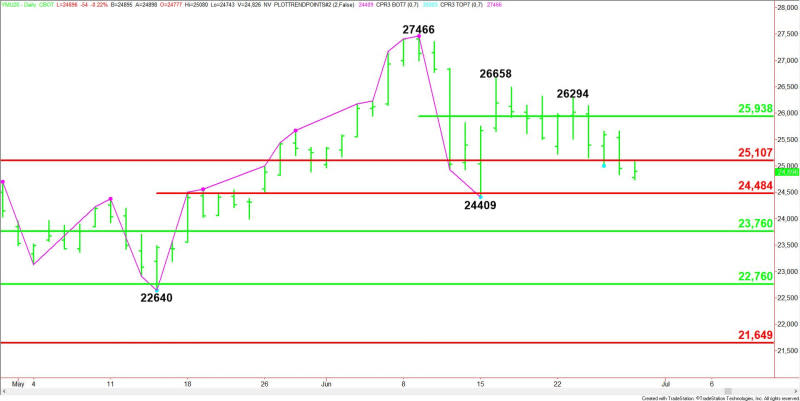
The main trend is up according to the daily swing chart. However, momentum has been trending lower since June 9. The main trend will change to down on a move through 22640. Taking out 27466 will negate the closing price reversal top and signal a resumption of the uptrend.
The minor trend is down. This confirms the shift in momentum to down. A trade through 24409 will reaffirm the downtrend, while a trade through 26294 will change the minor trend to up.
The short-term range is 27466 to 24409. Its 50% level or pivot at 25938 is resistance.
The main retracement zone is 25107 to 23760. This zone is controlling the longer-term direction of the Dow futures contract.
Another short-term range is 22640 to 27466. Its retracement zone at 25053 to 24484 is potential support. It falls inside the major retracement zone.
Early Look
The early tone is bearish after Friday’s close under the main Fibonacci level at 25107. This level also rejected an early attempt to breakout to the upside. The actual intraday high came in at 25080.
Based on the early price action, trader reaction to 25107 is likely to determine the direction of the September E-mini Dow Jones Industrial Average futures contract the rest of the session on Monday.
Bearish Tone
A sustained move under 25107 will signal the presence of sellers. If this move creates enough downside momentum then look for a break into 24484 to 24409. Taking out the latter could trigger an acceleration to the downside.
Bullish Tone
A bullish tone could develop on a sustained move over 25107. This will indicate that buyers came in on the test of the short-term retracement zone at 25053 to 24484.
A pair of highs at 25653 and 25659 are the first upside targets. Taking out 25659 could trigger a further rally into the pivot at 25938.
For a look at all of today’s economic events, check out our economic calendar.
This article was originally posted on FX Empire
