
 Yahoo Finance
 E-mini Dow Jones Industrial Average (YM) Futures Technical Analysis – Could Be Setting Up Closing Price Reversal Top
September E-mini Dow Jones Industrial Average futures are trading higher on Thursday but off their high. There hasn’t been much movement since the cash market opening despite a number of potentially bullish news events.
The market was initially supported by bullish news regarding U.S. China relations. This was followed by the news that the European Central Bank cut its benchmark interest rate and announced a bond buying program. There are also headlines saying the Trump administration is weighing an interim China trade deal.
At 14:46 GMT, September E-mini Dow Jones Industrial Average futures are trading 27247, up 103 or +0.37%.
The price action suggests investors may be a little reluctant to buy strength on the news this close to all-time highs.
Daily Technical Analysis
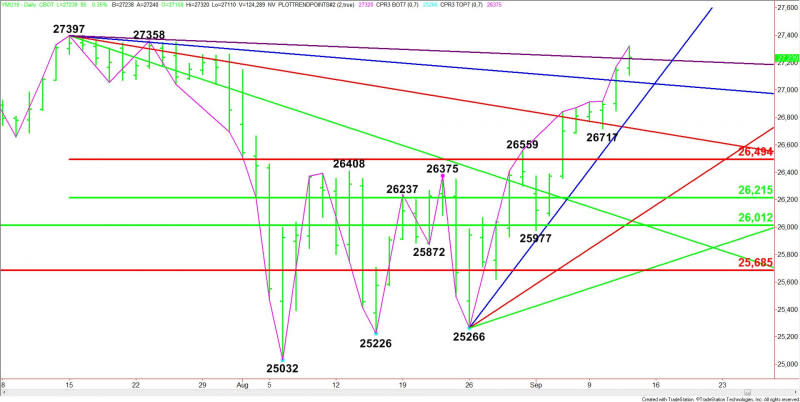
The main trend is up according to the daily swing chart. The uptrend was confirmed earlier today when buyers took out yesterday’s high.
The market is in no position to change the trend to down, but it is up 12 sessions from its last main bottom, which puts it in the window of time for a potentially bearish closing price reversal top. If confirmed, this chart pattern could trigger the start of a 2 to 3 day correction.
Based on the short-term range of 27397 to 25032, the nearest major support area is 26494 to 26215.
Daily Technical Forecast
Based on the early price action and the current price at 27247, the direction of the September E-mini Dow Jones Industrial Average futures contract the rest of the session is likely to be determined by trader reaction to yesterday’s close at 27144.
Bullish Scenario
A sustained move over 27144 will indicate the presence of buyers. The first target is the downtrending Gann angle at 27229. This is the last potential resistance angle before the 27358 and 27397 main tops.
Bearish Scenario
A sustained move under 27144 will signal the presence of sellers. The first target is a downtrending Gann angle at 27061. Crossing to the weak side of this angle could trigger an acceleration to the downside with the next target a steep uptrending Gann angle at 26802.
Overview
Traders aren’t responding to a series of bullish news stories, which could be an early indication that investors are becoming worried about value.
This article was originally posted on FX Empire
