
 Yahoo Finance
 E-mini NASDAQ-100 Index (NQ) Futures Technical Analysis – November 16, 2017 Forecast
Traders expect the December E-mini NASDAQ-100 Index futures contract to open higher based on the pre-market trade. The early price action suggests buyers may be ready to resume the uptrend after a four-day sell-off.
Daily Technical Analysis
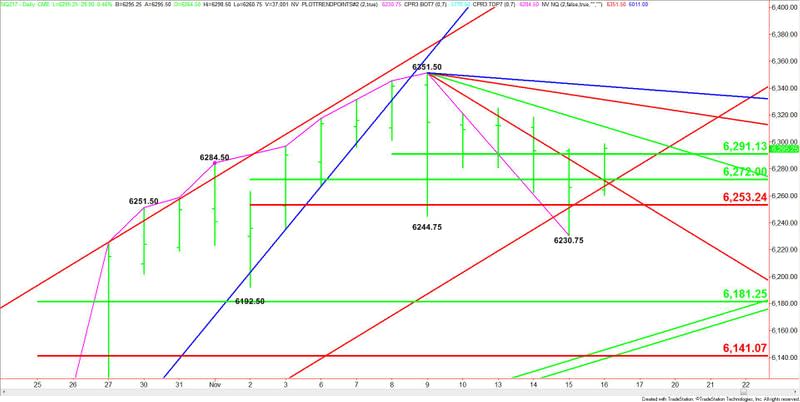
The main trend is up according to the daily swing chart. A trade through 6230.75 will indicate a shift in momentum to the downside. A rally through 6351.50 will signal a resumption of the uptrend.
The intermediate resistance zone at 6272.00 to 6253.25 is currently acting like support.
The short-term range is 6351.50 to 6230.75. Its 50% level or pivot is 6291.25. This level is controlling the daily momentum.
Daily Technical Forecast
Based on the early trade, the direction of the index today is likely to be determined by trader reaction to 6291.25.
A sustained move over 6291.25 will signal the presence of buyers. This could drive the index into a downtrending angle at 6311.50. This is followed by additional downtrending angles at 6331.50 and 6341.50. The latter is the last potential resistance angle before the 6351.50 main top.
A sustained move under 6291.25 will indicate the presence of sellers. The first downside target is a support cluster at 6272.00 to 6271.50. This area provided support earlier today.
If 6271.50 fails as support then look for the selling to continue into the Fib level at 6253.25.
The Fib level is a potential trigger point for a break into yesterday’s low at 6230.75. The daily chart is wide open to the downside. If enough selling pressure comes in under 6230.75 then the first major target comes in at 6181.25.
Basically, we’re looking for an upside bias to develop over 6291.25 and for a downside bias under 6253.25.
This article was originally posted on FX Empire
More From FXEMPIRE:
USD/JPY Fundamental Daily Forecast – Further Losses Likely if Tax Reform Stalls
E-mini S&P 500 Index (ES) Futures Technical Analysis – November 16, 2017 Forecast
Getting Back to Normal: Bitcoin Back Above $7,500, Bitcoin Cash Fall
Crude Oil Price Update – Trader Reaction to Gann Angle at $55.84 Will Determine Direction Today
