
 Yahoo Finance
 Earnings growth of 1.7% over 5 years hasn't been enough to translate into positive returns for LCNB (NASDAQ:LCNB) shareholders
Ideally, your overall portfolio should beat the market average. But the main game is to find enough winners to more than offset the losers At this point some shareholders may be questioning their investment in LCNB Corp. (NASDAQ:LCNB), since the last five years saw the share price fall 22%. Even worse, it's down 17% in about a month, which isn't fun at all.
Given the past week has been tough on shareholders, let's investigate the fundamentals and see what we can learn.
See our latest analysis for LCNB
There is no denying that markets are sometimes efficient, but prices do not always reflect underlying business performance. By comparing earnings per share (EPS) and share price changes over time, we can get a feel for how investor attitudes to a company have morphed over time.
During the unfortunate half decade during which the share price slipped, LCNB actually saw its earnings per share (EPS) improve by 8.7% per year. Given the share price reaction, one might suspect that EPS is not a good guide to the business performance during the period (perhaps due to a one-off loss or gain). Alternatively, growth expectations may have been unreasonable in the past.
It's strange to see such muted share price performance despite sustained growth. Perhaps a clue lies in other metrics.
The steady dividend doesn't really explain why the share price is down. It's not immediately clear to us why the stock price is down but further research might provide some answers.
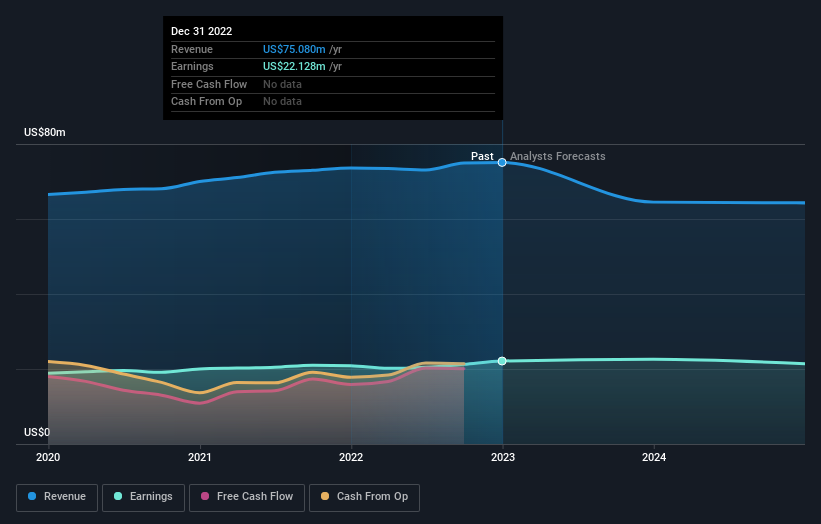
You can see how earnings and revenue have changed over time in the image below (click on the chart to see the exact values).
We like that insiders have been buying shares in the last twelve months. Having said that, most people consider earnings and revenue growth trends to be a more meaningful guide to the business. So we recommend checking out this free report showing consensus forecasts
What About Dividends?
It is important to consider the total shareholder return, as well as the share price return, for any given stock. The TSR is a return calculation that accounts for the value of cash dividends (assuming that any dividend received was reinvested) and the calculated value of any discounted capital raisings and spin-offs. So for companies that pay a generous dividend, the TSR is often a lot higher than the share price return. We note that for LCNB the TSR over the last 5 years was -2.9%, which is better than the share price return mentioned above. And there's no prize for guessing that the dividend payments largely explain the divergence!
A Different Perspective
While the broader market lost about 7.3% in the twelve months, LCNB shareholders did even worse, losing 9.9% (even including dividends). However, it could simply be that the share price has been impacted by broader market jitters. It might be worth keeping an eye on the fundamentals, in case there's a good opportunity. Regrettably, last year's performance caps off a bad run, with the shareholders facing a total loss of 0.6% per year over five years. Generally speaking long term share price weakness can be a bad sign, though contrarian investors might want to research the stock in hope of a turnaround. It's always interesting to track share price performance over the longer term. But to understand LCNB better, we need to consider many other factors. To that end, you should be aware of the 1 warning sign we've spotted with LCNB .
LCNB is not the only stock insiders are buying. So take a peek at this free list of growing companies with insider buying.
Please note, the market returns quoted in this article reflect the market weighted average returns of stocks that currently trade on US exchanges.
Have feedback on this article? Concerned about the content? Get in touch with us directly. Alternatively, email editorial-team (at) simplywallst.com.
This article by Simply Wall St is general in nature. We provide commentary based on historical data and analyst forecasts only using an unbiased methodology and our articles are not intended to be financial advice. It does not constitute a recommendation to buy or sell any stock, and does not take account of your objectives, or your financial situation. We aim to bring you long-term focused analysis driven by fundamental data. Note that our analysis may not factor in the latest price-sensitive company announcements or qualitative material. Simply Wall St has no position in any stocks mentioned.
Join A Paid User Research Session
You’ll receive a US$30 Amazon Gift card for 1 hour of your time while helping us build better investing tools for the individual investors like yourself. Sign up here
