
 Yahoo Finance
 Are Earnings Prospects Improving For Loss-Making Proofpoint Inc’s (NASDAQ:PFPT)?

Investors with a long-term horizong may find it valuable to assess Proofpoint Inc’s (NASDAQ:PFPT) earnings trend over time and against its industry benchmark as opposed to simply looking at a sincle earnings announcement at one point in time. Below is my commentary, albiet very simple and high-level, on how Proofpoint is currently performing. See our latest analysis for Proofpoint
Were PFPT’s earnings stronger than its past performances and the industry?
For the most up-to-date info, I use data from the most recent 12 months, which either annualizes the most recent 6-month earnings update, or in some cases, the most recent annual report is already the latest available financial data. This technique allows me to examine various companies on a similar basis, using the latest information. For Proofpoint, its most recent trailing-twelve-month earnings is -US$76.21M, which, in comparison to the prior year’s figure, has become less negative. Given that these figures may be somewhat short-term thinking, I have calculated an annualized five-year figure for PFPT’s net income, which stands at -US$61.15M. This shows that, Proofpoint has historically performed better than recently, despite the fact that it seems like earnings are now heading back towards to right direction again.
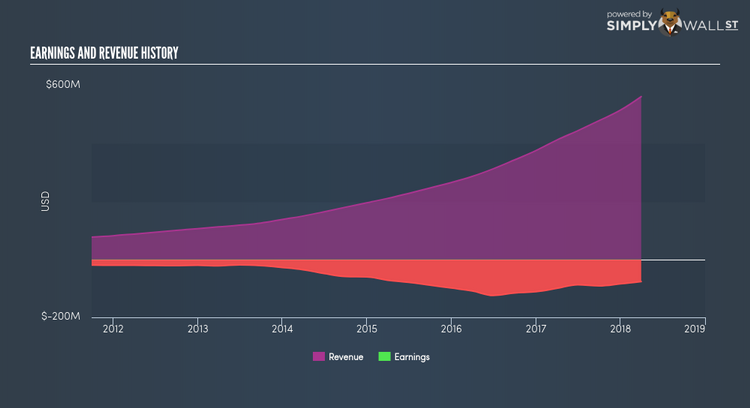
We can further evaluate Proofpoint’s loss by looking at what the industry has been experiencing over the past few years. Each year, for the past half a decade Proofpoint’s top-line has grown by 29.63% on average, signalling that the company is in a high-growth period with expenses shooting ahead of revenues, leading to annual losses. Eyeballing growth from a sector-level, the US software industry has been growing its average earnings by double-digit 13.27% over the previous year, and 12.92% over the previous five years. This means that, despite the fact that Proofpoint is currently running a loss, it may have been aided by industry tailwinds, moving earnings towards to right direction.
What does this mean?
Proofpoint’s track record can be a valuable insight into its earnings performance, but it certainly doesn’t tell the whole story. With companies that are currently loss-making, it is always difficult to forecast what will happen in the future and when. The most valuable step is to examine company-specific issues Proofpoint may be facing and whether management guidance has steadily been met in the past. I recommend you continue to research Proofpoint to get a better picture of the stock by looking at:
Future Outlook: What are well-informed industry analysts predicting for PFPT’s future growth? Take a look at our free research report of analyst consensus for PFPT’s outlook.
Financial Health: Is PFPT’s operations financially sustainable? Balance sheets can be hard to analyze, which is why we’ve done it for you. Check out our financial health checks here.
Other High-Performing Stocks: Are there other stocks that provide better prospects with proven track records? Explore our free list of these great stocks here.
NB: Figures in this article are calculated using data from the trailing twelve months from 31 March 2018. This may not be consistent with full year annual report figures.
To help readers see pass the short term volatility of the financial market, we aim to bring you a long-term focused research analysis purely driven by fundamental data. Note that our analysis does not factor in the latest price sensitive company announcements.
The author is an independent contributor and at the time of publication had no position in the stocks mentioned.
