
 Yahoo Finance
 Energy Recovery's (NASDAQ:ERII) Returns On Capital Not Reflecting Well On The Business
What trends should we look for it we want to identify stocks that can multiply in value over the long term? Amongst other things, we'll want to see two things; firstly, a growing return on capital employed (ROCE) and secondly, an expansion in the company's amount of capital employed. This shows us that it's a compounding machine, able to continually reinvest its earnings back into the business and generate higher returns. Having said that, from a first glance at Energy Recovery (NASDAQ:ERII) we aren't jumping out of our chairs at how returns are trending, but let's have a deeper look.
What Is Return On Capital Employed (ROCE)?
If you haven't worked with ROCE before, it measures the 'return' (pre-tax profit) a company generates from capital employed in its business. The formula for this calculation on Energy Recovery is:
Return on Capital Employed = Earnings Before Interest and Tax (EBIT) ÷ (Total Assets - Current Liabilities)
0.071 = US$16m ÷ (US$244m - US$17m) (Based on the trailing twelve months to March 2024).
Therefore, Energy Recovery has an ROCE of 7.1%. Ultimately, that's a low return and it under-performs the Machinery industry average of 13%.
Check out our latest analysis for Energy Recovery
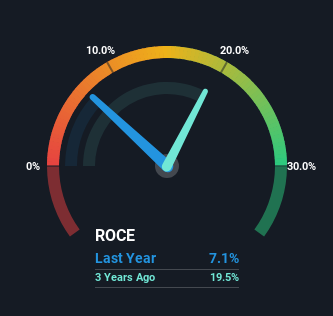
In the above chart we have measured Energy Recovery's prior ROCE against its prior performance, but the future is arguably more important. If you'd like, you can check out the forecasts from the analysts covering Energy Recovery for free.
What Does the ROCE Trend For Energy Recovery Tell Us?
On the surface, the trend of ROCE at Energy Recovery doesn't inspire confidence. To be more specific, ROCE has fallen from 9.0% over the last five years. Although, given both revenue and the amount of assets employed in the business have increased, it could suggest the company is investing in growth, and the extra capital has led to a short-term reduction in ROCE. If these investments prove successful, this can bode very well for long term stock performance.
Our Take On Energy Recovery's ROCE
In summary, despite lower returns in the short term, we're encouraged to see that Energy Recovery is reinvesting for growth and has higher sales as a result. In light of this, the stock has only gained 31% over the last five years. Therefore we'd recommend looking further into this stock to confirm if it has the makings of a good investment.
On a final note, we've found 1 warning sign for Energy Recovery that we think you should be aware of.
While Energy Recovery may not currently earn the highest returns, we've compiled a list of companies that currently earn more than 25% return on equity. Check out this free list here.
Have feedback on this article? Concerned about the content? Get in touch with us directly. Alternatively, email editorial-team (at) simplywallst.com.
This article by Simply Wall St is general in nature. We provide commentary based on historical data and analyst forecasts only using an unbiased methodology and our articles are not intended to be financial advice. It does not constitute a recommendation to buy or sell any stock, and does not take account of your objectives, or your financial situation. We aim to bring you long-term focused analysis driven by fundamental data. Note that our analysis may not factor in the latest price-sensitive company announcements or qualitative material. Simply Wall St has no position in any stocks mentioned.
Have feedback on this article? Concerned about the content? Get in touch with us directly. Alternatively, email editorial-team@simplywallst.com
