
 Yahoo Finance
 Estimating The Intrinsic Value Of Ethan Allen Interiors Inc. (NYSE:ETD)
Key Insights
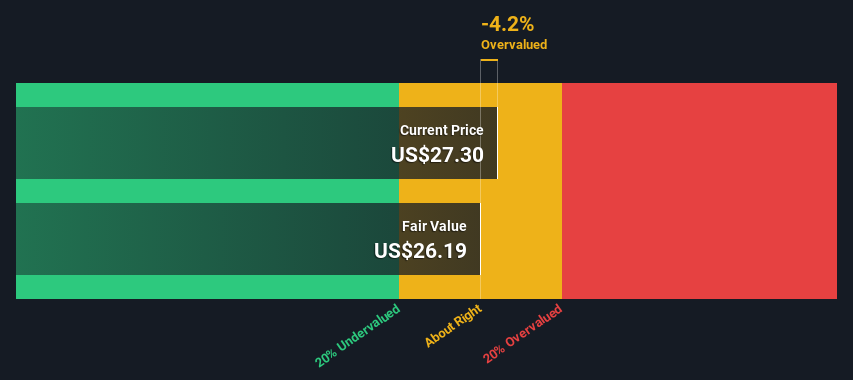
Using the 2 Stage Free Cash Flow to Equity, Ethan Allen Interiors fair value estimate is US$26.19
With US$27.30 share price, Ethan Allen Interiors appears to be trading close to its estimated fair value
Industry average of 75% suggests Ethan Allen Interiors' peers are currently trading at a higher premium to fair value
Today we will run through one way of estimating the intrinsic value of Ethan Allen Interiors Inc. (NYSE:ETD) by taking the forecast future cash flows of the company and discounting them back to today's value. We will use the Discounted Cash Flow (DCF) model on this occasion. Believe it or not, it's not too difficult to follow, as you'll see from our example!
We would caution that there are many ways of valuing a company and, like the DCF, each technique has advantages and disadvantages in certain scenarios. If you still have some burning questions about this type of valuation, take a look at the Simply Wall St analysis model.
View our latest analysis for Ethan Allen Interiors
What's The Estimated Valuation?
We use what is known as a 2-stage model, which simply means we have two different periods of growth rates for the company's cash flows. Generally the first stage is higher growth, and the second stage is a lower growth phase. To begin with, we have to get estimates of the next ten years of cash flows. Seeing as no analyst estimates of free cash flow are available to us, we have extrapolate the previous free cash flow (FCF) from the company's last reported value. We assume companies with shrinking free cash flow will slow their rate of shrinkage, and that companies with growing free cash flow will see their growth rate slow, over this period. We do this to reflect that growth tends to slow more in the early years than it does in later years.
A DCF is all about the idea that a dollar in the future is less valuable than a dollar today, so we discount the value of these future cash flows to their estimated value in today's dollars:
10-year free cash flow (FCF) estimate
2025 | 2026 | 2027 | 2028 | 2029 | 2030 | 2031 | 2032 | 2033 | 2034 | |
Levered FCF ($, Millions) | US$58.4m | US$52.3m | US$48.9m | US$47.0m | US$46.0m | US$45.7m | US$45.8m | US$46.2m | US$46.8m | US$47.6m |
Growth Rate Estimate Source | Est @ -15.96% | Est @ -10.46% | Est @ -6.61% | Est @ -3.91% | Est @ -2.02% | Est @ -0.70% | Est @ 0.22% | Est @ 0.87% | Est @ 1.32% | Est @ 1.64% |
Present Value ($, Millions) Discounted @ 8.6% | US$53.8 | US$44.4 | US$38.2 | US$33.8 | US$30.5 | US$27.9 | US$25.7 | US$23.9 | US$22.3 | US$20.9 |
("Est" = FCF growth rate estimated by Simply Wall St)
Present Value of 10-year Cash Flow (PVCF) = US$321m
We now need to calculate the Terminal Value, which accounts for all the future cash flows after this ten year period. The Gordon Growth formula is used to calculate Terminal Value at a future annual growth rate equal to the 5-year average of the 10-year government bond yield of 2.4%. We discount the terminal cash flows to today's value at a cost of equity of 8.6%.
Terminal Value (TV)= FCF2034 × (1 + g) ÷ (r – g) = US$48m× (1 + 2.4%) ÷ (8.6%– 2.4%) = US$785m
Present Value of Terminal Value (PVTV)= TV / (1 + r)10= US$785m÷ ( 1 + 8.6%)10= US$344m
The total value is the sum of cash flows for the next ten years plus the discounted terminal value, which results in the Total Equity Value, which in this case is US$666m. To get the intrinsic value per share, we divide this by the total number of shares outstanding. Compared to the current share price of US$27.3, the company appears around fair value at the time of writing. Remember though, that this is just an approximate valuation, and like any complex formula - garbage in, garbage out.
The Assumptions
Now the most important inputs to a discounted cash flow are the discount rate, and of course, the actual cash flows. Part of investing is coming up with your own evaluation of a company's future performance, so try the calculation yourself and check your own assumptions. The DCF also does not consider the possible cyclicality of an industry, or a company's future capital requirements, so it does not give a full picture of a company's potential performance. Given that we are looking at Ethan Allen Interiors as potential shareholders, the cost of equity is used as the discount rate, rather than the cost of capital (or weighted average cost of capital, WACC) which accounts for debt. In this calculation we've used 8.6%, which is based on a levered beta of 1.349. Beta is a measure of a stock's volatility, compared to the market as a whole. We get our beta from the industry average beta of globally comparable companies, with an imposed limit between 0.8 and 2.0, which is a reasonable range for a stable business.
Moving On:
Whilst important, the DCF calculation ideally won't be the sole piece of analysis you scrutinize for a company. The DCF model is not a perfect stock valuation tool. Rather it should be seen as a guide to "what assumptions need to be true for this stock to be under/overvalued?" For example, changes in the company's cost of equity or the risk free rate can significantly impact the valuation. For Ethan Allen Interiors, we've put together three fundamental aspects you should consider:
Risks: For example, we've discovered 2 warning signs for Ethan Allen Interiors (1 doesn't sit too well with us!) that you should be aware of before investing here.
Future Earnings: How does ETD's growth rate compare to its peers and the wider market? Dig deeper into the analyst consensus number for the upcoming years by interacting with our free analyst growth expectation chart.
Other High Quality Alternatives: Do you like a good all-rounder? Explore our interactive list of high quality stocks to get an idea of what else is out there you may be missing!
PS. Simply Wall St updates its DCF calculation for every American stock every day, so if you want to find the intrinsic value of any other stock just search here.
Have feedback on this article? Concerned about the content? Get in touch with us directly. Alternatively, email editorial-team (at) simplywallst.com.
This article by Simply Wall St is general in nature. We provide commentary based on historical data and analyst forecasts only using an unbiased methodology and our articles are not intended to be financial advice. It does not constitute a recommendation to buy or sell any stock, and does not take account of your objectives, or your financial situation. We aim to bring you long-term focused analysis driven by fundamental data. Note that our analysis may not factor in the latest price-sensitive company announcements or qualitative material. Simply Wall St has no position in any stocks mentioned.
Have feedback on this article? Concerned about the content? Get in touch with us directly. Alternatively, email editorial-team@simplywallst.com
