
 Yahoo Finance
 Evaluating Medicover AB (publ)’s (STO:MCOV B) Investments In Its Business

Today we'll evaluate Medicover AB (publ) (STO:MCOV B) to determine whether it could have potential as an investment idea. Specifically, we're going to calculate its Return On Capital Employed (ROCE), in the hopes of getting some insight into the business.
Firstly, we'll go over how we calculate ROCE. Next, we'll compare it to others in its industry. And finally, we'll look at how its current liabilities are impacting its ROCE.
Understanding Return On Capital Employed (ROCE)
ROCE is a metric for evaluating how much pre-tax income (in percentage terms) a company earns on the capital invested in its business. All else being equal, a better business will have a higher ROCE. Overall, it is a valuable metric that has its flaws. Author Edwin Whiting says to be careful when comparing the ROCE of different businesses, since 'No two businesses are exactly alike.
How Do You Calculate Return On Capital Employed?
The formula for calculating the return on capital employed is:
Return on Capital Employed = Earnings Before Interest and Tax (EBIT) ÷ (Total Assets - Current Liabilities)
Or for Medicover:
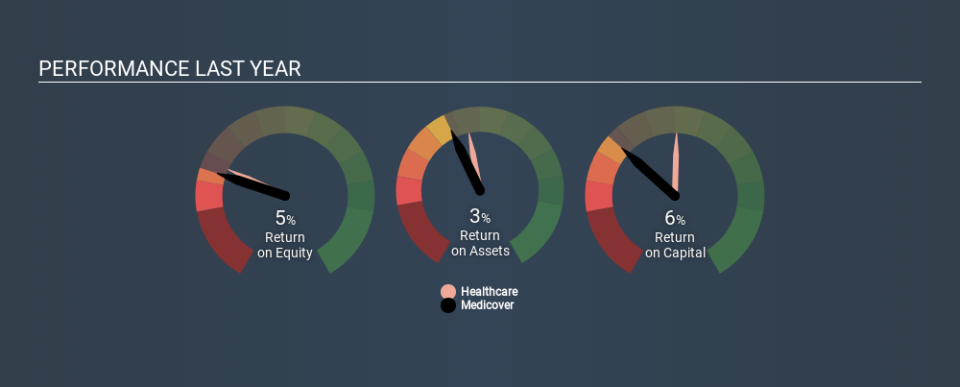
0.062 = €45m ÷ (€1.0b - €303m) (Based on the trailing twelve months to March 2020.)
Therefore, Medicover has an ROCE of 6.2%.
See our latest analysis for Medicover
Does Medicover Have A Good ROCE?
ROCE is commonly used for comparing the performance of similar businesses. Using our data, Medicover's ROCE appears to be around the 6.3% average of the Healthcare industry. Separate from how Medicover stacks up against its industry, its ROCE in absolute terms is mediocre; relative to the returns on government bonds. It is possible that there are more rewarding investments out there.
Medicover's current ROCE of 6.2% is lower than 3 years ago, when the company reported a 12% ROCE. This makes us wonder if the business is facing new challenges. You can click on the image below to see (in greater detail) how Medicover's past growth compares to other companies.
It is important to remember that ROCE shows past performance, and is not necessarily predictive. ROCE can be deceptive for cyclical businesses, as returns can look incredible in boom times, and terribly low in downturns. This is because ROCE only looks at one year, instead of considering returns across a whole cycle. What happens in the future is pretty important for investors, so we have prepared a free report on analyst forecasts for Medicover.
How Medicover's Current Liabilities Impact Its ROCE
Current liabilities are short term bills and invoices that need to be paid in 12 months or less. Due to the way ROCE is calculated, a high level of current liabilities makes a company look as though it has less capital employed, and thus can (sometimes unfairly) boost the ROCE. To counteract this, we check if a company has high current liabilities, relative to its total assets.
Medicover has total assets of €1.0b and current liabilities of €303m. Therefore its current liabilities are equivalent to approximately 30% of its total assets. This very reasonable level of current liabilities would not boost the ROCE by much.
What We Can Learn From Medicover's ROCE
That said, Medicover's ROCE is mediocre, there may be more attractive investments around. Of course, you might find a fantastic investment by looking at a few good candidates. So take a peek at this free list of companies with modest (or no) debt, trading on a P/E below 20.
Medicover is not the only stock that insiders are buying. For those who like to find winning investments this free list of growing companies with recent insider purchasing, could be just the ticket.
Love or hate this article? Concerned about the content? Get in touch with us directly. Alternatively, email editorial-team@simplywallst.com.
This article by Simply Wall St is general in nature. It does not constitute a recommendation to buy or sell any stock, and does not take account of your objectives, or your financial situation. We aim to bring you long-term focused analysis driven by fundamental data. Note that our analysis may not factor in the latest price-sensitive company announcements or qualitative material. Simply Wall St has no position in any stocks mentioned. Thank you for reading.
