
 Yahoo Finance
 Even after rising 20% this past week, Ferro-Alloy Resources (LON:FAR) shareholders are still down 60% over the past three years
Ferro-Alloy Resources Limited (LON:FAR) shareholders should be happy to see the share price up 20% in the last week. But over the last three years we've seen a quite serious decline. Regrettably, the share price slid 60% in that period. So it's good to see it climbing back up. Perhaps the company has turned over a new leaf.
Although the past week has been more reassuring for shareholders, they're still in the red over the last three years, so let's see if the underlying business has been responsible for the decline.
See our latest analysis for Ferro-Alloy Resources
Ferro-Alloy Resources wasn't profitable in the last twelve months, it is unlikely we'll see a strong correlation between its share price and its earnings per share (EPS). Arguably revenue is our next best option. Shareholders of unprofitable companies usually expect strong revenue growth. That's because fast revenue growth can be easily extrapolated to forecast profits, often of considerable size.
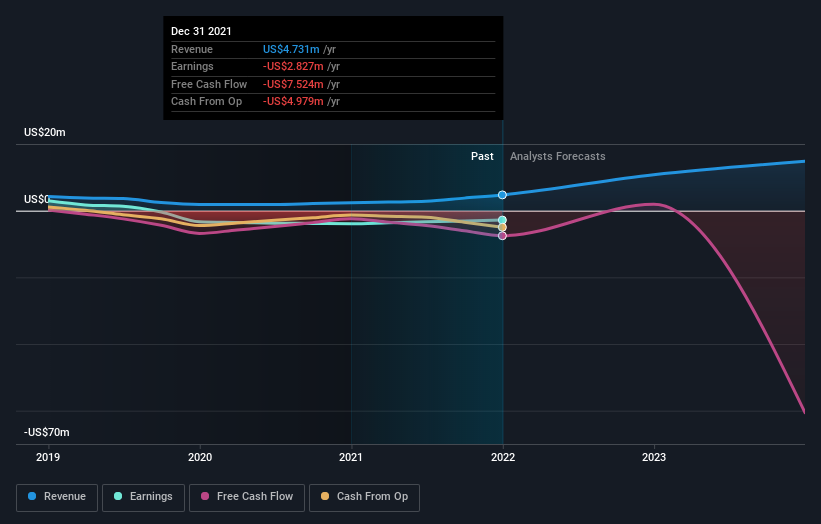
Over three years, Ferro-Alloy Resources grew revenue at 0.9% per year. That's not a very high growth rate considering it doesn't make profits. It's likely this weak growth has contributed to an annualised return of 17% for the last three years. When a stock falls hard like this, some investors like to add the company to a watchlist (in case the business recovers, longer term). After all, growing a business isn't easy, and the process will not always be smooth.
The image below shows how earnings and revenue have tracked over time (if you click on the image you can see greater detail).
You can see how its balance sheet has strengthened (or weakened) over time in this free interactive graphic.
A Different Perspective
The last twelve months weren't great for Ferro-Alloy Resources shares, which performed worse than the market, costing holders 53%. The market shed around 2.0%, no doubt weighing on the stock price. Shareholders have lost 17% per year over the last three years, so the share price drop has become steeper, over the last year; a potential symptom of as yet unsolved challenges. We would be wary of buying into a company with unsolved problems, although some investors will buy into struggling stocks if they believe the price is sufficiently attractive. While it is well worth considering the different impacts that market conditions can have on the share price, there are other factors that are even more important. For instance, we've identified 4 warning signs for Ferro-Alloy Resources (2 are a bit concerning) that you should be aware of.
If you would prefer to check out another company -- one with potentially superior financials -- then do not miss this free list of companies that have proven they can grow earnings.
Please note, the market returns quoted in this article reflect the market weighted average returns of stocks that currently trade on GB exchanges.
Have feedback on this article? Concerned about the content? Get in touch with us directly. Alternatively, email editorial-team (at) simplywallst.com.
This article by Simply Wall St is general in nature. We provide commentary based on historical data and analyst forecasts only using an unbiased methodology and our articles are not intended to be financial advice. It does not constitute a recommendation to buy or sell any stock, and does not take account of your objectives, or your financial situation. We aim to bring you long-term focused analysis driven by fundamental data. Note that our analysis may not factor in the latest price-sensitive company announcements or qualitative material. Simply Wall St has no position in any stocks mentioned.
Join A Paid User Research Session
You’ll receive a US$30 Amazon Gift card for 1 hour of your time while helping us build better investing tools for the individual investors like yourself. Sign up here
