
 Yahoo Finance
 Even after rising 5.1% this past week, Air Canada (TSE:AC) shareholders are still down 62% over the past three years
Investing in stocks inevitably means buying into some companies that perform poorly. Long term Air Canada (TSE:AC) shareholders know that all too well, since the share price is down considerably over three years. Regrettably, they have had to cope with a 62% drop in the share price over that period. The more recent news is of little comfort, with the share price down 24% in a year. On the other hand the share price has bounced 5.1% over the last week.
While the stock has risen 5.1% in the past week but long term shareholders are still in the red, let's see what the fundamentals can tell us.
View our latest analysis for Air Canada
Air Canada isn't currently profitable, so most analysts would look to revenue growth to get an idea of how fast the underlying business is growing. Shareholders of unprofitable companies usually expect strong revenue growth. That's because it's hard to be confident a company will be sustainable if revenue growth is negligible, and it never makes a profit.
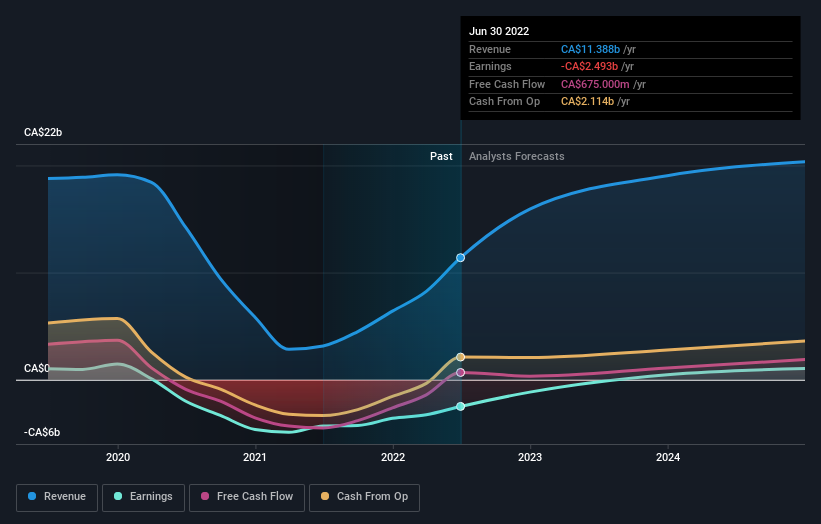
Over the last three years, Air Canada's revenue dropped 44% per year. That means its revenue trend is very weak compared to other loss making companies. With no profits and falling revenue it is no surprise that investors have been dumping the stock, pushing the price down by 17% per year over that time. Bagholders or 'baggies' are people who buy more of a stock as the price collapses. They are then left 'holding the bag' if the shares turn out to be worthless. It could be a while before the company repays long suffering shareholders with share price gains.
The image below shows how earnings and revenue have tracked over time (if you click on the image you can see greater detail).
It's good to see that there was some significant insider buying in the last three months. That's a positive. On the other hand, we think the revenue and earnings trends are much more meaningful measures of the business. So we recommend checking out this free report showing consensus forecasts
A Different Perspective
We regret to report that Air Canada shareholders are down 24% for the year. Unfortunately, that's worse than the broader market decline of 4.0%. However, it could simply be that the share price has been impacted by broader market jitters. It might be worth keeping an eye on the fundamentals, in case there's a good opportunity. Regrettably, last year's performance caps off a bad run, with the shareholders facing a total loss of 7% per year over five years. We realise that Baron Rothschild has said investors should "buy when there is blood on the streets", but we caution that investors should first be sure they are buying a high quality business. It's always interesting to track share price performance over the longer term. But to understand Air Canada better, we need to consider many other factors. To that end, you should be aware of the 1 warning sign we've spotted with Air Canada .
Air Canada is not the only stock insiders are buying. So take a peek at this free list of growing companies with insider buying.
Please note, the market returns quoted in this article reflect the market weighted average returns of stocks that currently trade on CA exchanges.
Have feedback on this article? Concerned about the content? Get in touch with us directly. Alternatively, email editorial-team (at) simplywallst.com.
This article by Simply Wall St is general in nature. We provide commentary based on historical data and analyst forecasts only using an unbiased methodology and our articles are not intended to be financial advice. It does not constitute a recommendation to buy or sell any stock, and does not take account of your objectives, or your financial situation. We aim to bring you long-term focused analysis driven by fundamental data. Note that our analysis may not factor in the latest price-sensitive company announcements or qualitative material. Simply Wall St has no position in any stocks mentioned.
Join A Paid User Research Session
You’ll receive a US$30 Amazon Gift card for 1 hour of your time while helping us build better investing tools for the individual investors like yourself. Sign up here
