
 Yahoo Finance
 Eversource Energy's (NYSE:ES) Returns Have Hit A Wall
If we want to find a potential multi-bagger, often there are underlying trends that can provide clues. One common approach is to try and find a company with returns on capital employed (ROCE) that are increasing, in conjunction with a growing amount of capital employed. Put simply, these types of businesses are compounding machines, meaning they are continually reinvesting their earnings at ever-higher rates of return. However, after briefly looking over the numbers, we don't think Eversource Energy (NYSE:ES) has the makings of a multi-bagger going forward, but let's have a look at why that may be.
Understanding Return On Capital Employed (ROCE)
For those who don't know, ROCE is a measure of a company's yearly pre-tax profit (its return), relative to the capital employed in the business. To calculate this metric for Eversource Energy, this is the formula:
Return on Capital Employed = Earnings Before Interest and Tax (EBIT) ÷ (Total Assets - Current Liabilities)
0.051 = US$2.6b ÷ (US$57b - US$6.4b) (Based on the trailing twelve months to March 2024).
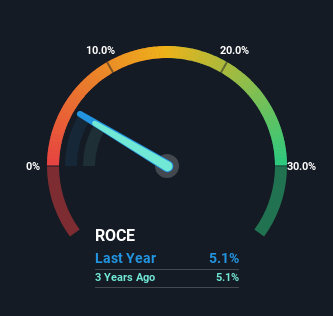
So, Eversource Energy has an ROCE of 5.1%. On its own that's a low return on capital but it's in line with the industry's average returns of 4.8%.
See our latest analysis for Eversource Energy
Above you can see how the current ROCE for Eversource Energy compares to its prior returns on capital, but there's only so much you can tell from the past. If you'd like, you can check out the forecasts from the analysts covering Eversource Energy for free.
What Does the ROCE Trend For Eversource Energy Tell Us?
The returns on capital haven't changed much for Eversource Energy in recent years. Over the past five years, ROCE has remained relatively flat at around 5.1% and the business has deployed 48% more capital into its operations. Given the company has increased the amount of capital employed, it appears the investments that have been made simply don't provide a high return on capital.
What We Can Learn From Eversource Energy's ROCE
In summary, Eversource Energy has simply been reinvesting capital and generating the same low rate of return as before. Unsurprisingly then, the total return to shareholders over the last five years has been flat. In any case, the stock doesn't have these traits of a multi-bagger discussed above, so if that's what you're looking for, we think you'd have more luck elsewhere.
One more thing, we've spotted 2 warning signs facing Eversource Energy that you might find interesting.
While Eversource Energy may not currently earn the highest returns, we've compiled a list of companies that currently earn more than 25% return on equity. Check out this free list here.
Have feedback on this article? Concerned about the content? Get in touch with us directly. Alternatively, email editorial-team (at) simplywallst.com.
This article by Simply Wall St is general in nature. We provide commentary based on historical data and analyst forecasts only using an unbiased methodology and our articles are not intended to be financial advice. It does not constitute a recommendation to buy or sell any stock, and does not take account of your objectives, or your financial situation. We aim to bring you long-term focused analysis driven by fundamental data. Note that our analysis may not factor in the latest price-sensitive company announcements or qualitative material. Simply Wall St has no position in any stocks mentioned.
