
 Yahoo Finance
 Should You Be Excited About Lobo EV Technologies Ltd.'s (NASDAQ:LOBO) 31% Return On Equity?
One of the best investments we can make is in our own knowledge and skill set. With that in mind, this article will work through how we can use Return On Equity (ROE) to better understand a business. To keep the lesson grounded in practicality, we'll use ROE to better understand Lobo EV Technologies Ltd. (NASDAQ:LOBO).
Return on Equity or ROE is a test of how effectively a company is growing its value and managing investors’ money. In other words, it is a profitability ratio which measures the rate of return on the capital provided by the company's shareholders.
See our latest analysis for Lobo EV Technologies
How Is ROE Calculated?
The formula for ROE is:
Return on Equity = Net Profit (from continuing operations) ÷ Shareholders' Equity
So, based on the above formula, the ROE for Lobo EV Technologies is:
31% = US$1.7m ÷ US$5.4m (Based on the trailing twelve months to June 2023).
The 'return' is the amount earned after tax over the last twelve months. One way to conceptualize this is that for each $1 of shareholders' capital it has, the company made $0.31 in profit.
Does Lobo EV Technologies Have A Good ROE?
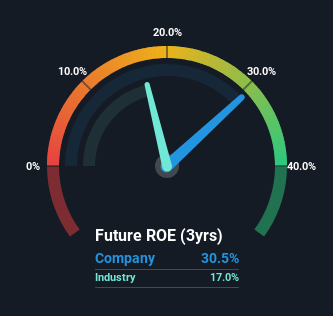
By comparing a company's ROE with its industry average, we can get a quick measure of how good it is. The limitation of this approach is that some companies are quite different from others, even within the same industry classification. As is clear from the image below, Lobo EV Technologies has a better ROE than the average (17%) in the Auto industry.
That is a good sign. However, bear in mind that a high ROE doesn’t necessarily indicate efficient profit generation. A higher proportion of debt in a company's capital structure may also result in a high ROE, where the high debt levels could be a huge risk . You can see the 3 risks we have identified for Lobo EV Technologies by visiting our risks dashboard for free on our platform here.
How Does Debt Impact ROE?
Virtually all companies need money to invest in the business, to grow profits. That cash can come from retained earnings, issuing new shares (equity), or debt. In the first and second cases, the ROE will reflect this use of cash for investment in the business. In the latter case, the debt used for growth will improve returns, but won't affect the total equity. In this manner the use of debt will boost ROE, even though the core economics of the business stay the same.
Combining Lobo EV Technologies' Debt And Its 31% Return On Equity
Lobo EV Technologies has a debt to equity ratio of 0.23, which is far from excessive. Its ROE is very impressive, and given only modest debt, this suggests the business is high quality. Careful use of debt to boost returns is often very good for shareholders. However, it could reduce the company's ability to take advantage of future opportunities.
Summary
Return on equity is useful for comparing the quality of different businesses. Companies that can achieve high returns on equity without too much debt are generally of good quality. If two companies have around the same level of debt to equity, and one has a higher ROE, I'd generally prefer the one with higher ROE.
But when a business is high quality, the market often bids it up to a price that reflects this. The rate at which profits are likely to grow, relative to the expectations of profit growth reflected in the current price, must be considered, too. You can see how the company has grow in the past by looking at this FREE detailed graph of past earnings, revenue and cash flow.
If you would prefer check out another company -- one with potentially superior financials -- then do not miss this free list of interesting companies, that have HIGH return on equity and low debt.
Have feedback on this article? Concerned about the content? Get in touch with us directly. Alternatively, email editorial-team (at) simplywallst.com.
This article by Simply Wall St is general in nature. We provide commentary based on historical data and analyst forecasts only using an unbiased methodology and our articles are not intended to be financial advice. It does not constitute a recommendation to buy or sell any stock, and does not take account of your objectives, or your financial situation. We aim to bring you long-term focused analysis driven by fundamental data. Note that our analysis may not factor in the latest price-sensitive company announcements or qualitative material. Simply Wall St has no position in any stocks mentioned.
