
 Yahoo Finance
 Should We Be Excited About The Trends Of Returns At CVS Group (LON:CVSG)?
What are the early trends we should look for to identify a stock that could multiply in value over the long term? Firstly, we'll want to see a proven return on capital employed (ROCE) that is increasing, and secondly, an expanding base of capital employed. If you see this, it typically means it's a company with a great business model and plenty of profitable reinvestment opportunities. However, after briefly looking over the numbers, we don't think CVS Group (LON:CVSG) has the makings of a multi-bagger going forward, but let's have a look at why that may be.
What is Return On Capital Employed (ROCE)?
Just to clarify if you're unsure, ROCE is a metric for evaluating how much pre-tax income (in percentage terms) a company earns on the capital invested in its business. To calculate this metric for CVS Group, this is the formula:
Return on Capital Employed = Earnings Before Interest and Tax (EBIT) ÷ (Total Assets - Current Liabilities)
0.051 = UK£19m ÷ (UK£464m - UK£102m) (Based on the trailing twelve months to June 2020).
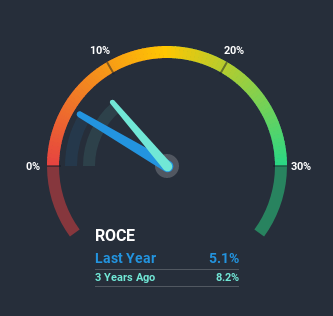
Therefore, CVS Group has an ROCE of 5.1%. Ultimately, that's a low return and it under-performs the Healthcare industry average of 9.0%.
View our latest analysis for CVS Group
In the above chart we have measured CVS Group's prior ROCE against its prior performance, but the future is arguably more important. If you'd like, you can check out the forecasts from the analysts covering CVS Group here for free.
How Are Returns Trending?
When we looked at the ROCE trend at CVS Group, we didn't gain much confidence. Around five years ago the returns on capital were 12%, but since then they've fallen to 5.1%. Meanwhile, the business is utilizing more capital but this hasn't moved the needle much in terms of sales in the past 12 months, so this could reflect longer term investments. It's worth keeping an eye on the company's earnings from here on to see if these investments do end up contributing to the bottom line.
On a related note, CVS Group has decreased its current liabilities to 22% of total assets. So we could link some of this to the decrease in ROCE. Effectively this means their suppliers or short-term creditors are funding less of the business, which reduces some elements of risk. Some would claim this reduces the business' efficiency at generating ROCE since it is now funding more of the operations with its own money.
In Conclusion...
To conclude, we've found that CVS Group is reinvesting in the business, but returns have been falling. Yet to long term shareholders the stock has gifted them an incredible 137% return in the last five years, so the market appears to be rosy about its future. However, unless these underlying trends turn more positive, we wouldn't get our hopes up too high.
CVS Group does have some risks, we noticed 2 warning signs (and 1 which is concerning) we think you should know about.
While CVS Group may not currently earn the highest returns, we've compiled a list of companies that currently earn more than 25% return on equity. Check out this free list here.
This article by Simply Wall St is general in nature. It does not constitute a recommendation to buy or sell any stock, and does not take account of your objectives, or your financial situation. We aim to bring you long-term focused analysis driven by fundamental data. Note that our analysis may not factor in the latest price-sensitive company announcements or qualitative material. Simply Wall St has no position in any stocks mentioned.
Have feedback on this article? Concerned about the content? Get in touch with us directly. Alternatively, email editorial-team (at) simplywallst.com.
