
 Yahoo Finance
 Fair Isaac's (NYSE:FICO) five-year total shareholder returns outpace the underlying earnings growth
While Fair Isaac Corporation (NYSE:FICO) shareholders are probably generally happy, the stock hasn't had particularly good run recently, with the share price falling 11% in the last quarter. But that doesn't change the fact that the returns over the last five years have been very strong. In fact, the share price is 243% higher today. So while it's never fun to see a share price fall, it's important to look at a longer time horizon. Of course, that doesn't necessarily mean it's cheap now.
Although Fair Isaac has shed US$649m from its market cap this week, let's take a look at its longer term fundamental trends and see if they've driven returns.
See our latest analysis for Fair Isaac
While markets are a powerful pricing mechanism, share prices reflect investor sentiment, not just underlying business performance. One imperfect but simple way to consider how the market perception of a company has shifted is to compare the change in the earnings per share (EPS) with the share price movement.
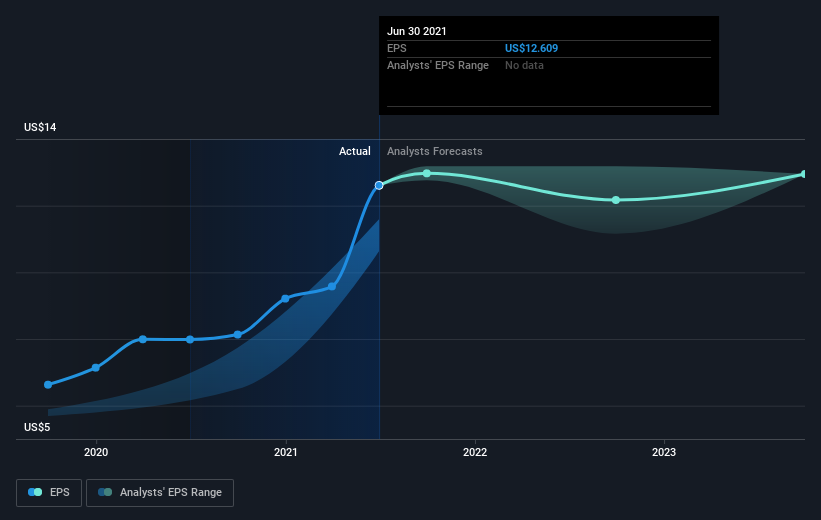
During five years of share price growth, Fair Isaac achieved compound earnings per share (EPS) growth of 29% per year. That makes the EPS growth particularly close to the yearly share price growth of 28%. Therefore one could conclude that sentiment towards the shares hasn't morphed very much. Indeed, it would appear the share price is reacting to the EPS.
You can see how EPS has changed over time in the image below (click on the chart to see the exact values).
We know that Fair Isaac has improved its bottom line over the last three years, but what does the future have in store? If you are thinking of buying or selling Fair Isaac stock, you should check out this FREE detailed report on its balance sheet.
A Different Perspective
Fair Isaac provided a TSR of 4.6% over the last twelve months. But that was short of the market average. It's probably a good sign that the company has an even better long term track record, having provided shareholders with an annual TSR of 28% over five years. It may well be that this is a business worth popping on the watching, given the continuing positive reception, over time, from the market. I find it very interesting to look at share price over the long term as a proxy for business performance. But to truly gain insight, we need to consider other information, too. Even so, be aware that Fair Isaac is showing 2 warning signs in our investment analysis , and 1 of those is a bit unpleasant...
If you would prefer to check out another company -- one with potentially superior financials -- then do not miss this free list of companies that have proven they can grow earnings.
Please note, the market returns quoted in this article reflect the market weighted average returns of stocks that currently trade on US exchanges.
This article by Simply Wall St is general in nature. We provide commentary based on historical data and analyst forecasts only using an unbiased methodology and our articles are not intended to be financial advice. It does not constitute a recommendation to buy or sell any stock, and does not take account of your objectives, or your financial situation. We aim to bring you long-term focused analysis driven by fundamental data. Note that our analysis may not factor in the latest price-sensitive company announcements or qualitative material. Simply Wall St has no position in any stocks mentioned.
Have feedback on this article? Concerned about the content? Get in touch with us directly. Alternatively, email editorial-team (at) simplywallst.com.
