
 Yahoo Finance
 What Is Faurecia's (EPA:EO) P/E Ratio After Its Share Price Tanked?

Unfortunately for some shareholders, the Faurecia (EPA:EO) share price has dived 33% in the last thirty days. Even longer term holders have taken a real hit with the stock declining 24% in the last year.
All else being equal, a share price drop should make a stock more attractive to potential investors. While the market sentiment towards a stock is very changeable, in the long run, the share price will tend to move in the same direction as earnings per share. The implication here is that long term investors have an opportunity when expectations of a company are too low. Perhaps the simplest way to get a read on investors' expectations of a business is to look at its Price to Earnings Ratio (PE Ratio). A high P/E implies that investors have high expectations of what a company can achieve compared to a company with a low P/E ratio.
View our latest analysis for Faurecia
Does Faurecia Have A Relatively High Or Low P/E For Its Industry?
Faurecia has a P/E ratio of 6.56. The image below shows that Faurecia has a P/E ratio that is roughly in line with the auto components industry average (6.6).
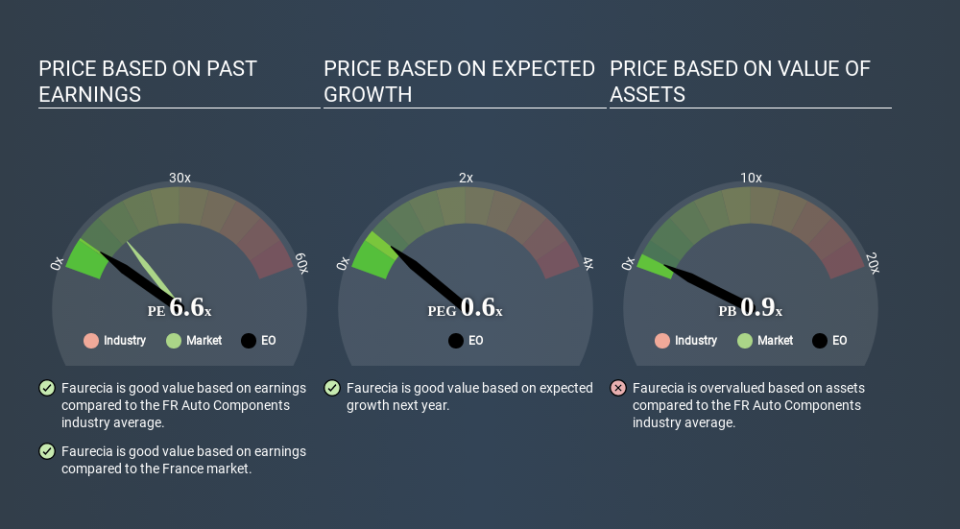
That indicates that the market expects Faurecia will perform roughly in line with other companies in its industry. So if Faurecia actually outperforms its peers going forward, that should be a positive for the share price. Checking factors such as director buying and selling. could help you form your own view on if that will happen.
How Growth Rates Impact P/E Ratios
Probably the most important factor in determining what P/E a company trades on is the earnings growth. If earnings are growing quickly, then the 'E' in the equation will increase faster than it would otherwise. That means even if the current P/E is high, it will reduce over time if the share price stays flat. Then, a lower P/E should attract more buyers, pushing the share price up.
Faurecia saw earnings per share decrease by 16% last year. But over the longer term (5 years) earnings per share have increased by 34%.
Don't Forget: The P/E Does Not Account For Debt or Bank Deposits
One drawback of using a P/E ratio is that it considers market capitalization, but not the balance sheet. So it won't reflect the advantage of cash, or disadvantage of debt. Hypothetically, a company could reduce its future P/E ratio by spending its cash (or taking on debt) to achieve higher earnings.
Such spending might be good or bad, overall, but the key point here is that you need to look at debt to understand the P/E ratio in context.
How Does Faurecia's Debt Impact Its P/E Ratio?
Faurecia has net debt equal to 41% of its market cap. While it's worth keeping this in mind, it isn't a worry.
The Bottom Line On Faurecia's P/E Ratio
Faurecia's P/E is 6.6 which is below average (13.5) in the FR market. The debt levels are not a major concern, but the lack of EPS growth is likely weighing on sentiment. Given Faurecia's P/E ratio has declined from 9.8 to 6.6 in the last month, we know for sure that the market is more worried about the business today, than it was back then. For those who prefer to invest with the flow of momentum, that might be a bad sign, but for deep value investors this stock might justify some research.
Investors have an opportunity when market expectations about a stock are wrong. As value investor Benjamin Graham famously said, 'In the short run, the market is a voting machine but in the long run, it is a weighing machine. So this free visualization of the analyst consensus on future earnings could help you make the right decision about whether to buy, sell, or hold.
Of course, you might find a fantastic investment by looking at a few good candidates. So take a peek at this free list of companies with modest (or no) debt, trading on a P/E below 20.
If you spot an error that warrants correction, please contact the editor at editorial-team@simplywallst.com. This article by Simply Wall St is general in nature. It does not constitute a recommendation to buy or sell any stock, and does not take account of your objectives, or your financial situation. Simply Wall St has no position in the stocks mentioned.
We aim to bring you long-term focused research analysis driven by fundamental data. Note that our analysis may not factor in the latest price-sensitive company announcements or qualitative material. Thank you for reading.
