
 Yahoo Finance
 Ferroglobe PLC's (NASDAQ:GSM) Price Is Right But Growth Is Lacking
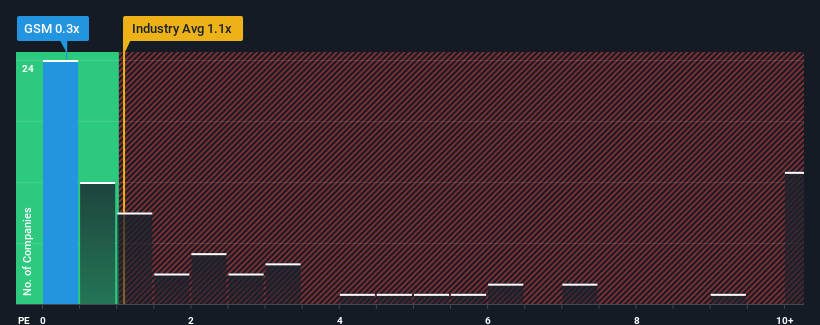
With a price-to-sales (or "P/S") ratio of 0.3x Ferroglobe PLC (NASDAQ:GSM) may be sending bullish signals at the moment, given that almost half of all the Metals and Mining companies in the United States have P/S ratios greater than 1.1x and even P/S higher than 5x are not unusual. However, the P/S might be low for a reason and it requires further investigation to determine if it's justified.
View our latest analysis for Ferroglobe
What Does Ferroglobe's P/S Mean For Shareholders?
With revenue growth that's superior to most other companies of late, Ferroglobe has been doing relatively well. It might be that many expect the strong revenue performance to degrade substantially, which has repressed the share price, and thus the P/S ratio. If not, then existing shareholders have reason to be quite optimistic about the future direction of the share price.
Want the full picture on analyst estimates for the company? Then our free report on Ferroglobe will help you uncover what's on the horizon.
How Is Ferroglobe's Revenue Growth Trending?
There's an inherent assumption that a company should underperform the industry for P/S ratios like Ferroglobe's to be considered reasonable.
Taking a look back first, we see that the company grew revenue by an impressive 46% last year. Pleasingly, revenue has also lifted 61% in aggregate from three years ago, thanks to the last 12 months of growth. Accordingly, shareholders would have definitely welcomed those medium-term rates of revenue growth.
Turning to the outlook, the next three years should bring diminished returns, with revenue decreasing 7.5% each year as estimated by the two analysts watching the company. With the industry predicted to deliver 1.6% growth each year, that's a disappointing outcome.
With this in consideration, we find it intriguing that Ferroglobe's P/S is closely matching its industry peers. Nonetheless, there's no guarantee the P/S has reached a floor yet with revenue going in reverse. Even just maintaining these prices could be difficult to achieve as the weak outlook is weighing down the shares.
What We Can Learn From Ferroglobe's P/S?
Typically, we'd caution against reading too much into price-to-sales ratios when settling on investment decisions, though it can reveal plenty about what other market participants think about the company.
With revenue forecasts that are inferior to the rest of the industry, it's no surprise that Ferroglobe's P/S is on the lower end of the spectrum. As other companies in the industry are forecasting revenue growth, Ferroglobe's poor outlook justifies its low P/S ratio. Unless there's material change, it's hard to envision a situation where the stock price will rise drastically.
Having said that, be aware Ferroglobe is showing 1 warning sign in our investment analysis, you should know about.
If you're unsure about the strength of Ferroglobe's business, why not explore our interactive list of stocks with solid business fundamentals for some other companies you may have missed.
Have feedback on this article? Concerned about the content? Get in touch with us directly. Alternatively, email editorial-team (at) simplywallst.com.
This article by Simply Wall St is general in nature. We provide commentary based on historical data and analyst forecasts only using an unbiased methodology and our articles are not intended to be financial advice. It does not constitute a recommendation to buy or sell any stock, and does not take account of your objectives, or your financial situation. We aim to bring you long-term focused analysis driven by fundamental data. Note that our analysis may not factor in the latest price-sensitive company announcements or qualitative material. Simply Wall St has no position in any stocks mentioned.
Join A Paid User Research Session
You’ll receive a US$30 Amazon Gift card for 1 hour of your time while helping us build better investing tools for the individual investors like yourself. Sign up here
