
 Yahoo Finance
 How Financially Strong Is Palo Alto Networks Inc (NYSE:PANW)?

There are a number of reasons that attract investors towards large-cap companies such as Palo Alto Networks Inc (NYSE:PANW), with a market cap of US$19.26B. Big corporations are much sought after by risk-averse investors who find diversified revenue streams and strong capital returns attractive. But, the key to extending previous success is in the health of the company’s financials. I will provide an overview of Palo Alto Networks’s financial liquidity and leverage to give you an idea of Palo Alto Networks’s position to take advantage of potential acquisitions or comfortably endure future downturns. Remember this is a very top-level look that focuses exclusively on financial health, so I recommend a deeper analysis into PANW here. View our latest analysis for Palo Alto Networks
Does PANW produce enough cash relative to debt?
PANW’s debt level has been constant at around US$524.70M over the previous year made up of current and long term debt. At this current level of debt, PANW’s cash and short-term investments stands at US$1.38B , ready to deploy into the business. On top of this, PANW has generated US$868.50M in operating cash flow over the same time period, resulting in an operating cash to total debt ratio of 165.52%, indicating that PANW’s current level of operating cash is high enough to cover debt. This ratio can also be a sign of operational efficiency for unprofitable businesses since metrics such as return on asset (ROA) requires positive earnings. In PANW’s case, it is able to generate 1.66x cash from its debt capital.
Does PANW’s liquid assets cover its short-term commitments?
Looking at PANW’s most recent US$1.20B liabilities, it seems that the business has maintained a safe level of current assets to meet its obligations, with the current ratio last standing at 1.65x. Usually, for Communications companies, this is a suitable ratio since there is a bit of a cash buffer without leaving too much capital in a low-return environment.
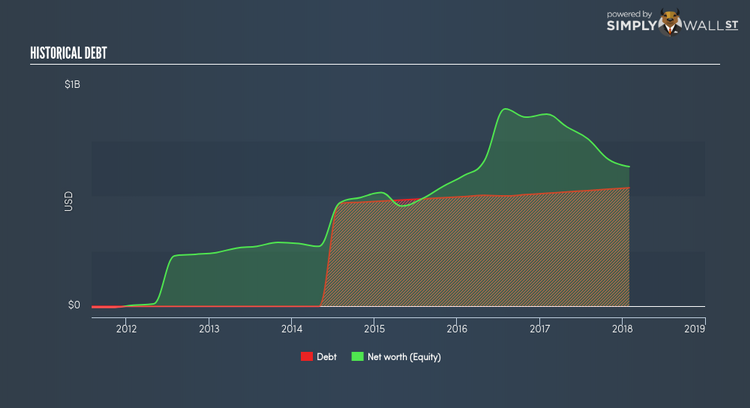
Can PANW service its debt comfortably?
PANW is a relatively highly levered company with a debt-to-equity of 84.88%. This is not unusual for large-caps since debt tends to be less expensive than equity because interest payments are tax deductible. Consequently, larger-cap organisations tend to enjoy lower cost of capital as a result of easily attained financing, providing an advantage over smaller companies. But since PANW is currently unprofitable, sustainability of its current state of operations becomes a concern. Maintaining a high level of debt, while revenues are still below costs, can be dangerous as liquidity tends to dry up in unexpected downturns.
Next Steps:
Although PANW’s debt level is towards the higher end of the spectrum, its cash flow coverage seems adequate to meet obligations which means its debt is being efficiently utilised. Since there is also no concerns around PANW’s liquidity needs, this may be its optimal capital structure for the time being. This is only a rough assessment of financial health, and I’m sure PANW has company-specific issues impacting its capital structure decisions. I suggest you continue to research Palo Alto Networks to get a better picture of the large-cap by looking at:
Future Outlook: What are well-informed industry analysts predicting for PANW’s future growth? Take a look at our free research report of analyst consensus for PANW’s outlook.
Valuation: What is PANW worth today? Is the stock undervalued, even when its growth outlook is factored into its intrinsic value? The intrinsic value infographic in our free research report helps visualize whether PANW is currently mispriced by the market.
Other High-Performing Stocks: Are there other stocks that provide better prospects with proven track records? Explore our free list of these great stocks here.
To help readers see pass the short term volatility of the financial market, we aim to bring you a long-term focused research analysis purely driven by fundamental data. Note that our analysis does not factor in the latest price sensitive company announcements.
The author is an independent contributor and at the time of publication had no position in the stocks mentioned.
