
 Yahoo Finance
 Is Fiore Gold Ltd.'s (CVE:F) P/E Ratio Really That Good?

This article is written for those who want to get better at using price to earnings ratios (P/E ratios). We'll apply a basic P/E ratio analysis to Fiore Gold Ltd.'s (CVE:F), to help you decide if the stock is worth further research. What is Fiore Gold's P/E ratio? Well, based on the last twelve months it is 16.26. That corresponds to an earnings yield of approximately 6.1%.
View our latest analysis for Fiore Gold
How Do I Calculate A Price To Earnings Ratio?
The formula for price to earnings is:
Price to Earnings Ratio = Price per Share (in the reporting currency) ÷ Earnings per Share (EPS)
Or for Fiore Gold:
P/E of 16.26 = USD0.40 (Note: this is the share price in the reporting currency, namely, USD ) ÷ USD0.02 (Based on the year to September 2019.)
Is A High Price-to-Earnings Ratio Good?
The higher the P/E ratio, the higher the price tag of a business, relative to its trailing earnings. All else being equal, it's better to pay a low price -- but as Warren Buffett said, 'It's far better to buy a wonderful company at a fair price than a fair company at a wonderful price'.
Does Fiore Gold Have A Relatively High Or Low P/E For Its Industry?
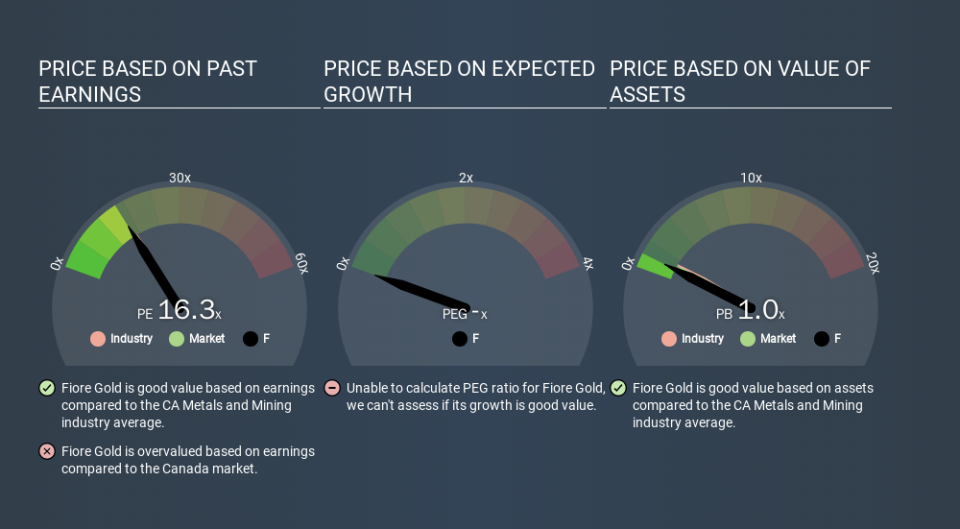
The P/E ratio essentially measures market expectations of a company. The image below shows that Fiore Gold has a P/E ratio that is roughly in line with the metals and mining industry average (17.1).
Fiore Gold's P/E tells us that market participants think its prospects are roughly in line with its industry. The company could surprise by performing better than average, in the future. Further research into factors such as insider buying and selling, could help you form your own view on whether that is likely.
How Growth Rates Impact P/E Ratios
P/E ratios primarily reflect market expectations around earnings growth rates. If earnings are growing quickly, then the 'E' in the equation will increase faster than it would otherwise. That means even if the current P/E is high, it will reduce over time if the share price stays flat. Then, a lower P/E should attract more buyers, pushing the share price up.
In the last year, Fiore Gold grew EPS like Taylor Swift grew her fan base back in 2010; the 115% gain was both fast and well deserved.
A Limitation: P/E Ratios Ignore Debt and Cash In The Bank
It's important to note that the P/E ratio considers the market capitalization, not the enterprise value. That means it doesn't take debt or cash into account. Hypothetically, a company could reduce its future P/E ratio by spending its cash (or taking on debt) to achieve higher earnings.
Spending on growth might be good or bad a few years later, but the point is that the P/E ratio does not account for the option (or lack thereof).
So What Does Fiore Gold's Balance Sheet Tell Us?
Fiore Gold has net cash of US$7.3m. This is fairly high at 18% of its market capitalization. That might mean balance sheet strength is important to the business, but should also help push the P/E a bit higher than it would otherwise be.
The Verdict On Fiore Gold's P/E Ratio
Fiore Gold has a P/E of 16.3. That's around the same as the average in the CA market, which is 15.7. The excess cash it carries is the gravy on top its fast EPS growth. So at a glance we're a bit surprised that Fiore Gold does not have a higher P/E ratio.
Investors have an opportunity when market expectations about a stock are wrong. As value investor Benjamin Graham famously said, 'In the short run, the market is a voting machine but in the long run, it is a weighing machine. Although we don't have analyst forecasts shareholders might want to examine this detailed historical graph of earnings, revenue and cash flow.
Of course, you might find a fantastic investment by looking at a few good candidates. So take a peek at this free list of companies with modest (or no) debt, trading on a P/E below 20.
If you spot an error that warrants correction, please contact the editor at editorial-team@simplywallst.com. This article by Simply Wall St is general in nature. It does not constitute a recommendation to buy or sell any stock, and does not take account of your objectives, or your financial situation. Simply Wall St has no position in the stocks mentioned.
We aim to bring you long-term focused research analysis driven by fundamental data. Note that our analysis may not factor in the latest price-sensitive company announcements or qualitative material. Thank you for reading.
