
 Yahoo Finance
 The five-year loss for Discovery (JSE:DSY) shareholders likely driven by its shrinking earnings
The main aim of stock picking is to find the market-beating stocks. But the main game is to find enough winners to more than offset the losers So we wouldn't blame long term Discovery Limited (JSE:DSY) shareholders for doubting their decision to hold, with the stock down 17% over a half decade. Furthermore, it's down 13% in about a quarter. That's not much fun for holders.
Although the past week has been more reassuring for shareholders, they're still in the red over the last five years, so let's see if the underlying business has been responsible for the decline.
View our latest analysis for Discovery
While markets are a powerful pricing mechanism, share prices reflect investor sentiment, not just underlying business performance. By comparing earnings per share (EPS) and share price changes over time, we can get a feel for how investor attitudes to a company have morphed over time.
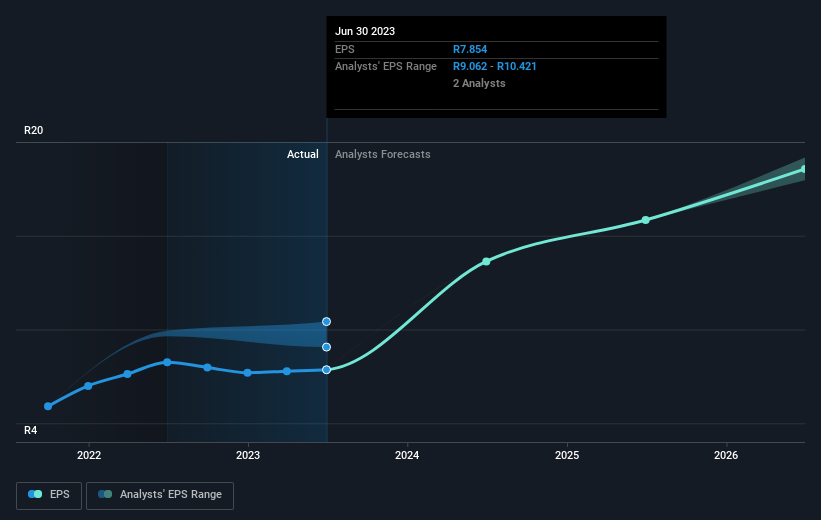
Looking back five years, both Discovery's share price and EPS declined; the latter at a rate of 2.2% per year. Readers should note that the share price has fallen faster than the EPS, at a rate of 4% per year, over the period. So it seems the market was too confident about the business, in the past.
You can see how EPS has changed over time in the image below (click on the chart to see the exact values).
We know that Discovery has improved its bottom line over the last three years, but what does the future have in store? This free interactive report on Discovery's balance sheet strength is a great place to start, if you want to investigate the stock further.
What About Dividends?
When looking at investment returns, it is important to consider the difference between total shareholder return (TSR) and share price return. The TSR incorporates the value of any spin-offs or discounted capital raisings, along with any dividends, based on the assumption that the dividends are reinvested. Arguably, the TSR gives a more comprehensive picture of the return generated by a stock. In the case of Discovery, it has a TSR of -14% for the last 5 years. That exceeds its share price return that we previously mentioned. This is largely a result of its dividend payments!
A Different Perspective
It's nice to see that Discovery shareholders have received a total shareholder return of 9.0% over the last year. Of course, that includes the dividend. Notably the five-year annualised TSR loss of 3% per year compares very unfavourably with the recent share price performance. This makes us a little wary, but the business might have turned around its fortunes. Before spending more time on Discovery it might be wise to click here to see if insiders have been buying or selling shares.
If you are like me, then you will not want to miss this free list of growing companies that insiders are buying.
Please note, the market returns quoted in this article reflect the market weighted average returns of stocks that currently trade on South African exchanges.
Have feedback on this article? Concerned about the content? Get in touch with us directly. Alternatively, email editorial-team (at) simplywallst.com.
This article by Simply Wall St is general in nature. We provide commentary based on historical data and analyst forecasts only using an unbiased methodology and our articles are not intended to be financial advice. It does not constitute a recommendation to buy or sell any stock, and does not take account of your objectives, or your financial situation. We aim to bring you long-term focused analysis driven by fundamental data. Note that our analysis may not factor in the latest price-sensitive company announcements or qualitative material. Simply Wall St has no position in any stocks mentioned.
