
 Yahoo Finance
 Getting In Cheap On Fastned B.V. (AMS:FAST) Might Be Difficult
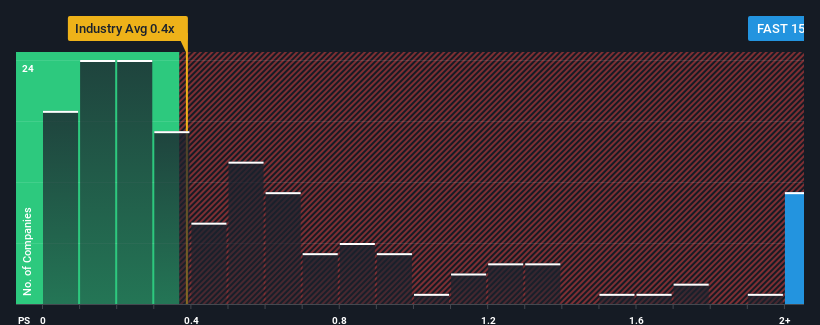
When close to half the companies in the Specialty Retail industry in the Netherlands have price-to-sales ratios (or "P/S") below 0.4x, you may consider Fastned B.V. (AMS:FAST) as a stock to avoid entirely with its 15x P/S ratio. Nonetheless, we'd need to dig a little deeper to determine if there is a rational basis for the highly elevated P/S.
See our latest analysis for Fastned B.V
How Fastned B.V Has Been Performing
Fastned B.V certainly has been doing a good job lately as it's been growing revenue more than most other companies. The P/S is probably high because investors think this strong revenue performance will continue. You'd really hope so, otherwise you're paying a pretty hefty price for no particular reason.
Want the full picture on analyst estimates for the company? Then our free report on Fastned B.V will help you uncover what's on the horizon.
What Are Revenue Growth Metrics Telling Us About The High P/S?
There's an inherent assumption that a company should far outperform the industry for P/S ratios like Fastned B.V's to be considered reasonable.
If we review the last year of revenue growth, the company posted a terrific increase of 189%. The latest three year period has also seen an incredible overall rise in revenue, aided by its incredible short-term performance. So we can start by confirming that the company has done a tremendous job of growing revenue over that time.
Shifting to the future, estimates from the five analysts covering the company suggest revenue should grow by 72% each year over the next three years. That's shaping up to be materially higher than the 7.8% each year growth forecast for the broader industry.
In light of this, it's understandable that Fastned B.V's P/S sits above the majority of other companies. Apparently shareholders aren't keen to offload something that is potentially eyeing a more prosperous future.
The Key Takeaway
We'd say the price-to-sales ratio's power isn't primarily as a valuation instrument but rather to gauge current investor sentiment and future expectations.
As we suspected, our examination of Fastned B.V's analyst forecasts revealed that its superior revenue outlook is contributing to its high P/S. It appears that shareholders are confident in the company's future revenues, which is propping up the P/S. Unless the analysts have really missed the mark, these strong revenue forecasts should keep the share price buoyant.
There are also other vital risk factors to consider before investing and we've discovered 1 warning sign for Fastned B.V that you should be aware of.
If you're unsure about the strength of Fastned B.V's business, why not explore our interactive list of stocks with solid business fundamentals for some other companies you may have missed.
Have feedback on this article? Concerned about the content? Get in touch with us directly. Alternatively, email editorial-team (at) simplywallst.com.
This article by Simply Wall St is general in nature. We provide commentary based on historical data and analyst forecasts only using an unbiased methodology and our articles are not intended to be financial advice. It does not constitute a recommendation to buy or sell any stock, and does not take account of your objectives, or your financial situation. We aim to bring you long-term focused analysis driven by fundamental data. Note that our analysis may not factor in the latest price-sensitive company announcements or qualitative material. Simply Wall St has no position in any stocks mentioned.
Join A Paid User Research Session
You’ll receive a US$30 Amazon Gift card for 1 hour of your time while helping us build better investing tools for the individual investors like yourself. Sign up here
