
 Yahoo Finance
 GFT Technologies (ETR:GFT) Is Experiencing Growth In Returns On Capital
What trends should we look for it we want to identify stocks that can multiply in value over the long term? Typically, we'll want to notice a trend of growing return on capital employed (ROCE) and alongside that, an expanding base of capital employed. This shows us that it's a compounding machine, able to continually reinvest its earnings back into the business and generate higher returns. Speaking of which, we noticed some great changes in GFT Technologies' (ETR:GFT) returns on capital, so let's have a look.
Understanding Return On Capital Employed (ROCE)
If you haven't worked with ROCE before, it measures the 'return' (pre-tax profit) a company generates from capital employed in its business. The formula for this calculation on GFT Technologies is:
Return on Capital Employed = Earnings Before Interest and Tax (EBIT) ÷ (Total Assets - Current Liabilities)
0.19 = €71m ÷ (€644m - €269m) (Based on the trailing twelve months to March 2024).
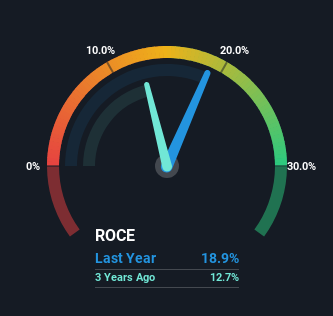
So, GFT Technologies has an ROCE of 19%. In absolute terms, that's a satisfactory return, but compared to the IT industry average of 9.6% it's much better.
Check out our latest analysis for GFT Technologies
In the above chart we have measured GFT Technologies' prior ROCE against its prior performance, but the future is arguably more important. If you'd like, you can check out the forecasts from the analysts covering GFT Technologies for free.
So How Is GFT Technologies' ROCE Trending?
The trends we've noticed at GFT Technologies are quite reassuring. The data shows that returns on capital have increased substantially over the last five years to 19%. The amount of capital employed has increased too, by 22%. So we're very much inspired by what we're seeing at GFT Technologies thanks to its ability to profitably reinvest capital.
For the record though, there was a noticeable increase in the company's current liabilities over the period, so we would attribute some of the ROCE growth to that. Essentially the business now has suppliers or short-term creditors funding about 42% of its operations, which isn't ideal. Given it's pretty high ratio, we'd remind investors that having current liabilities at those levels can bring about some risks in certain businesses.
What We Can Learn From GFT Technologies' ROCE
All in all, it's terrific to see that GFT Technologies is reaping the rewards from prior investments and is growing its capital base. And a remarkable 312% total return over the last five years tells us that investors are expecting more good things to come in the future. So given the stock has proven it has promising trends, it's worth researching the company further to see if these trends are likely to persist.
On a final note, we've found 1 warning sign for GFT Technologies that we think you should be aware of.
While GFT Technologies isn't earning the highest return, check out this free list of companies that are earning high returns on equity with solid balance sheets.
Have feedback on this article? Concerned about the content? Get in touch with us directly. Alternatively, email editorial-team (at) simplywallst.com.
This article by Simply Wall St is general in nature. We provide commentary based on historical data and analyst forecasts only using an unbiased methodology and our articles are not intended to be financial advice. It does not constitute a recommendation to buy or sell any stock, and does not take account of your objectives, or your financial situation. We aim to bring you long-term focused analysis driven by fundamental data. Note that our analysis may not factor in the latest price-sensitive company announcements or qualitative material. Simply Wall St has no position in any stocks mentioned.
