
 Yahoo Finance
 Givaudan SA's Dividend Analysis
Assessing the Fragrance Giant's Dividend Profile
Givaudan SA (GVDNY) recently announced a dividend of $1.58 per share, payable on 2024-04-11, with the ex-dividend date set for 2024-03-25. As investors look forward to this upcoming payment, the spotlight also shines on the company's dividend history, yield, and growth rates. Using the data from GuruFocus, let's look into Givaudan SA's dividend performance and assess its sustainability.
What Does Givaudan SA Do?
This Powerful Chart Made Peter Lynch 29% A Year For 13 Years
How to calculate the intrinsic value of a stock?
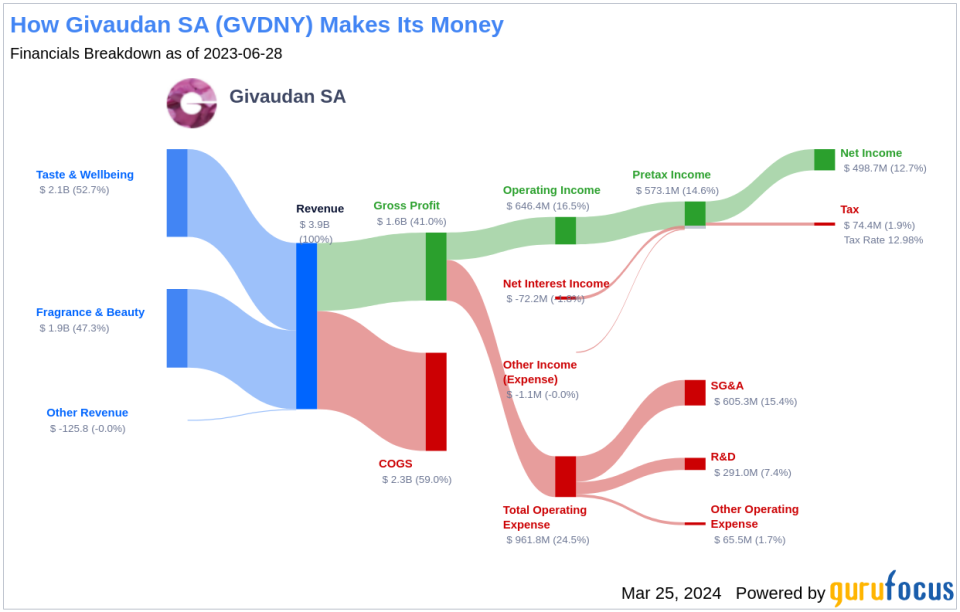
Spun off from Roche in 2000, Givaudan is one of the world's leading flavour and fragrance manufacturers, with a presence in more than 80 countries. It sources more than 10,000 different ingredients from 100 countries. The company serves end consumer markets with fragrances for personal-, home-, and laundry-care brands, including prestige perfumes. In flavours, customers are in beverages, savoury, snacks, sweet goods, and dairy. Givaudan has nearly 10,000 employees, and its perfumery team is the largest in the industry.
A Glimpse at Givaudan SA's Dividend History
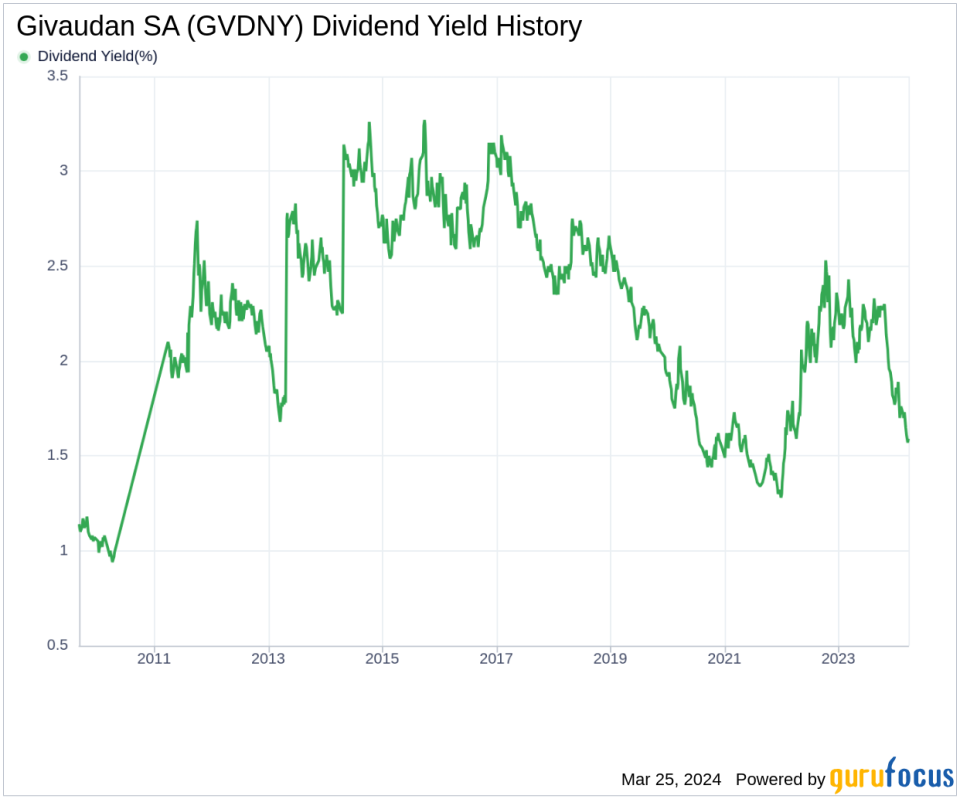
Givaudan SA has maintained a consistent dividend payment record since 2011. Dividends are currently distributed on a yearly basis. Givaudan SA has increased its dividend each year since 2011. The stock is thus listed as a dividend achiever, an honor that is given to companies that have increased their dividend each year for at least the past 13 years. Below is a chart showing annual Dividends Per Share for tracking historical trends.
Breaking Down Givaudan SA's Dividend Yield and Growth
As of today, Givaudan SA currently has a 12-month trailing dividend yield of 1.59% and a 12-month forward dividend yield of 1.72%. This suggests an expectation of increased dividend payments over the next 12 months.
Over the past three years, Givaudan SA's annual dividend growth rate was 2.60%. Extended to a five-year horizon, this rate increased to 3.00% per year. And over the past decade, Givaudan SA's annual dividends per share growth rate stands at 5.20%.
Based on Givaudan SA's dividend yield and five-year growth rate, the 5-year yield on cost of Givaudan SA stock as of today is approximately 1.84%.
The Sustainability Question: Payout Ratio and Profitability
To assess the sustainability of the dividend, one needs to evaluate the company's payout ratio. The dividend payout ratio provides insights into the portion of earnings the company distributes as dividends. A lower ratio suggests that the company retains a significant part of its earnings, thereby ensuring the availability of funds for future growth and unexpected downturns. As of 2023-12-31, Givaudan SA's dividend payout ratio is 0.62.
Givaudan SA's profitability rank, offers an understanding of the company's earnings prowess relative to its peers. GuruFocus ranks Givaudan SA's profitability 9 out of 10 as of 2023-12-31, suggesting good profitability prospects. The company has reported positive net income for each of year over the past decade, further solidifying its high profitability.
Growth Metrics: The Future Outlook
To ensure the sustainability of dividends, a company must have robust growth metrics. Givaudan SA's growth rank of 9 out of 10 suggests that the company's growth trajectory is good relative to its competitors.
Revenue is the lifeblood of any company, and Givaudan SA's revenue per share, combined with the 3-year revenue growth rate, indicates a strong revenue model. Givaudan SA's revenue has increased by approximately 3.20% per year on average, a rate that underperforms than approximately 69.79% of global competitors.
The company's 3-year EPS growth rate showcases its capability to grow its earnings, a critical component for sustaining dividends in the long run. During the past three years, Givaudan SA's earnings increased by approximately 9.60% per year on average, a rate that underperforms than approximately 50.75% of global competitors.
Lastly, the company's 5-year EBITDA growth rate of 8.70%, which underperforms than approximately 50.63% of global competitors.
Final Thoughts on Givaudan SA's Dividend Outlook
In conclusion, Givaudan SA has demonstrated a commitment to growing its dividends, backed by a solid history of consistent dividend payments. The company's dividend growth rate, along with a reasonable payout ratio and strong profitability rank, suggest a sustainable dividend policy. However, when considering future prospects, it's important to note that while Givaudan SA's growth metrics indicate good potential, some of its growth rates underperform when compared to global competitors. Investors should weigh these factors when evaluating the long-term sustainability of Givaudan SA's dividends. For those seeking to explore further, GuruFocus Premium users can screen for high-dividend yield stocks using the High Dividend Yield Screener.
This article, generated by GuruFocus, is designed to provide general insights and is not tailored financial advice. Our commentary is rooted in historical data and analyst projections, utilizing an impartial methodology, and is not intended to serve as specific investment guidance. It does not formulate a recommendation to purchase or divest any stock and does not consider individual investment objectives or financial circumstances. Our objective is to deliver long-term, fundamental data-driven analysis. Be aware that our analysis might not incorporate the most recent, price-sensitive company announcements or qualitative information. GuruFocus holds no position in the stocks mentioned herein.
This article first appeared on GuruFocus.
